Case Study
Table Of Contents
1. Introduction
A major challenge in software engineering is understanding what's happening in production systems. The processes between a system's input and output can be like a black box, and the challenge of seeing inside that box becomes increasingly difficult as systems grow in complexity.
Logs and traces are two types of data that can help developers gain insight into their system. Logs give a micro-level view of specific events happening in the system, and traces give a macro-level view, providing system-wide insight.
Together, these data types can provide a lot of context about a distributed system, but there are many challenges around using them together effectively. Hypha was built to address those challenges and to help developers understand and debug their systems.
1.1 What is Hypha?
Hypha is an open-source observability framework for distributed systems that combines the context of traces with the detail of logs.
Hypha deploys an end-to-end telemetry pipeline that sets up distributed tracing, aggregates existing logs, and correlates logs with traces. This facilitates a powerful debugging workflow using Hypha's simple UI.
2. Observability
In software engineering, there are many interpretations and approaches to the concept of observability. For consistency, we will use the following definition: Observability is "a measure of how well internal states of a system can be inferred from knowledge of its external outputs." [1]
At a fundamental level, software systems boil down to inputs and outputs. The computer takes an input, runs the software, and produces an output. But, what if the output is incorrect or the system is unresponsive? How can we inspect the internal state to solve the issue?
2.1 Telemetry
The answer is that we must output additional data that tells us about the internal state of the system. The data output for this purpose is called telemetry, and code written to output telemetry is called instrumentation. There are different types of telemetry, with the three most common being logs, metrics, and traces. These are often called the "Three Pillars" of observability. [2]
Metrics
Metrics are a numerical measure that provides a snapshot of some aspect of a system's behavior during a certain period of time. For instance, this could be requests per second, CPU or memory usage over time, or errors per minute. This data is usually visualized in a dashboard, providing a quick overview of a system's health.
Logs
Logs are human-readable lines of text that provide specific detail about an event. They provide fine-grained, detailed information originating from a single application.

Traces
Traces provide context for how a given request travels through the system and how different system components interact. Traces are a bit more complex than metrics and logs, so to illustrate, let's start with an architecture diagram that shows connections between components of a system.
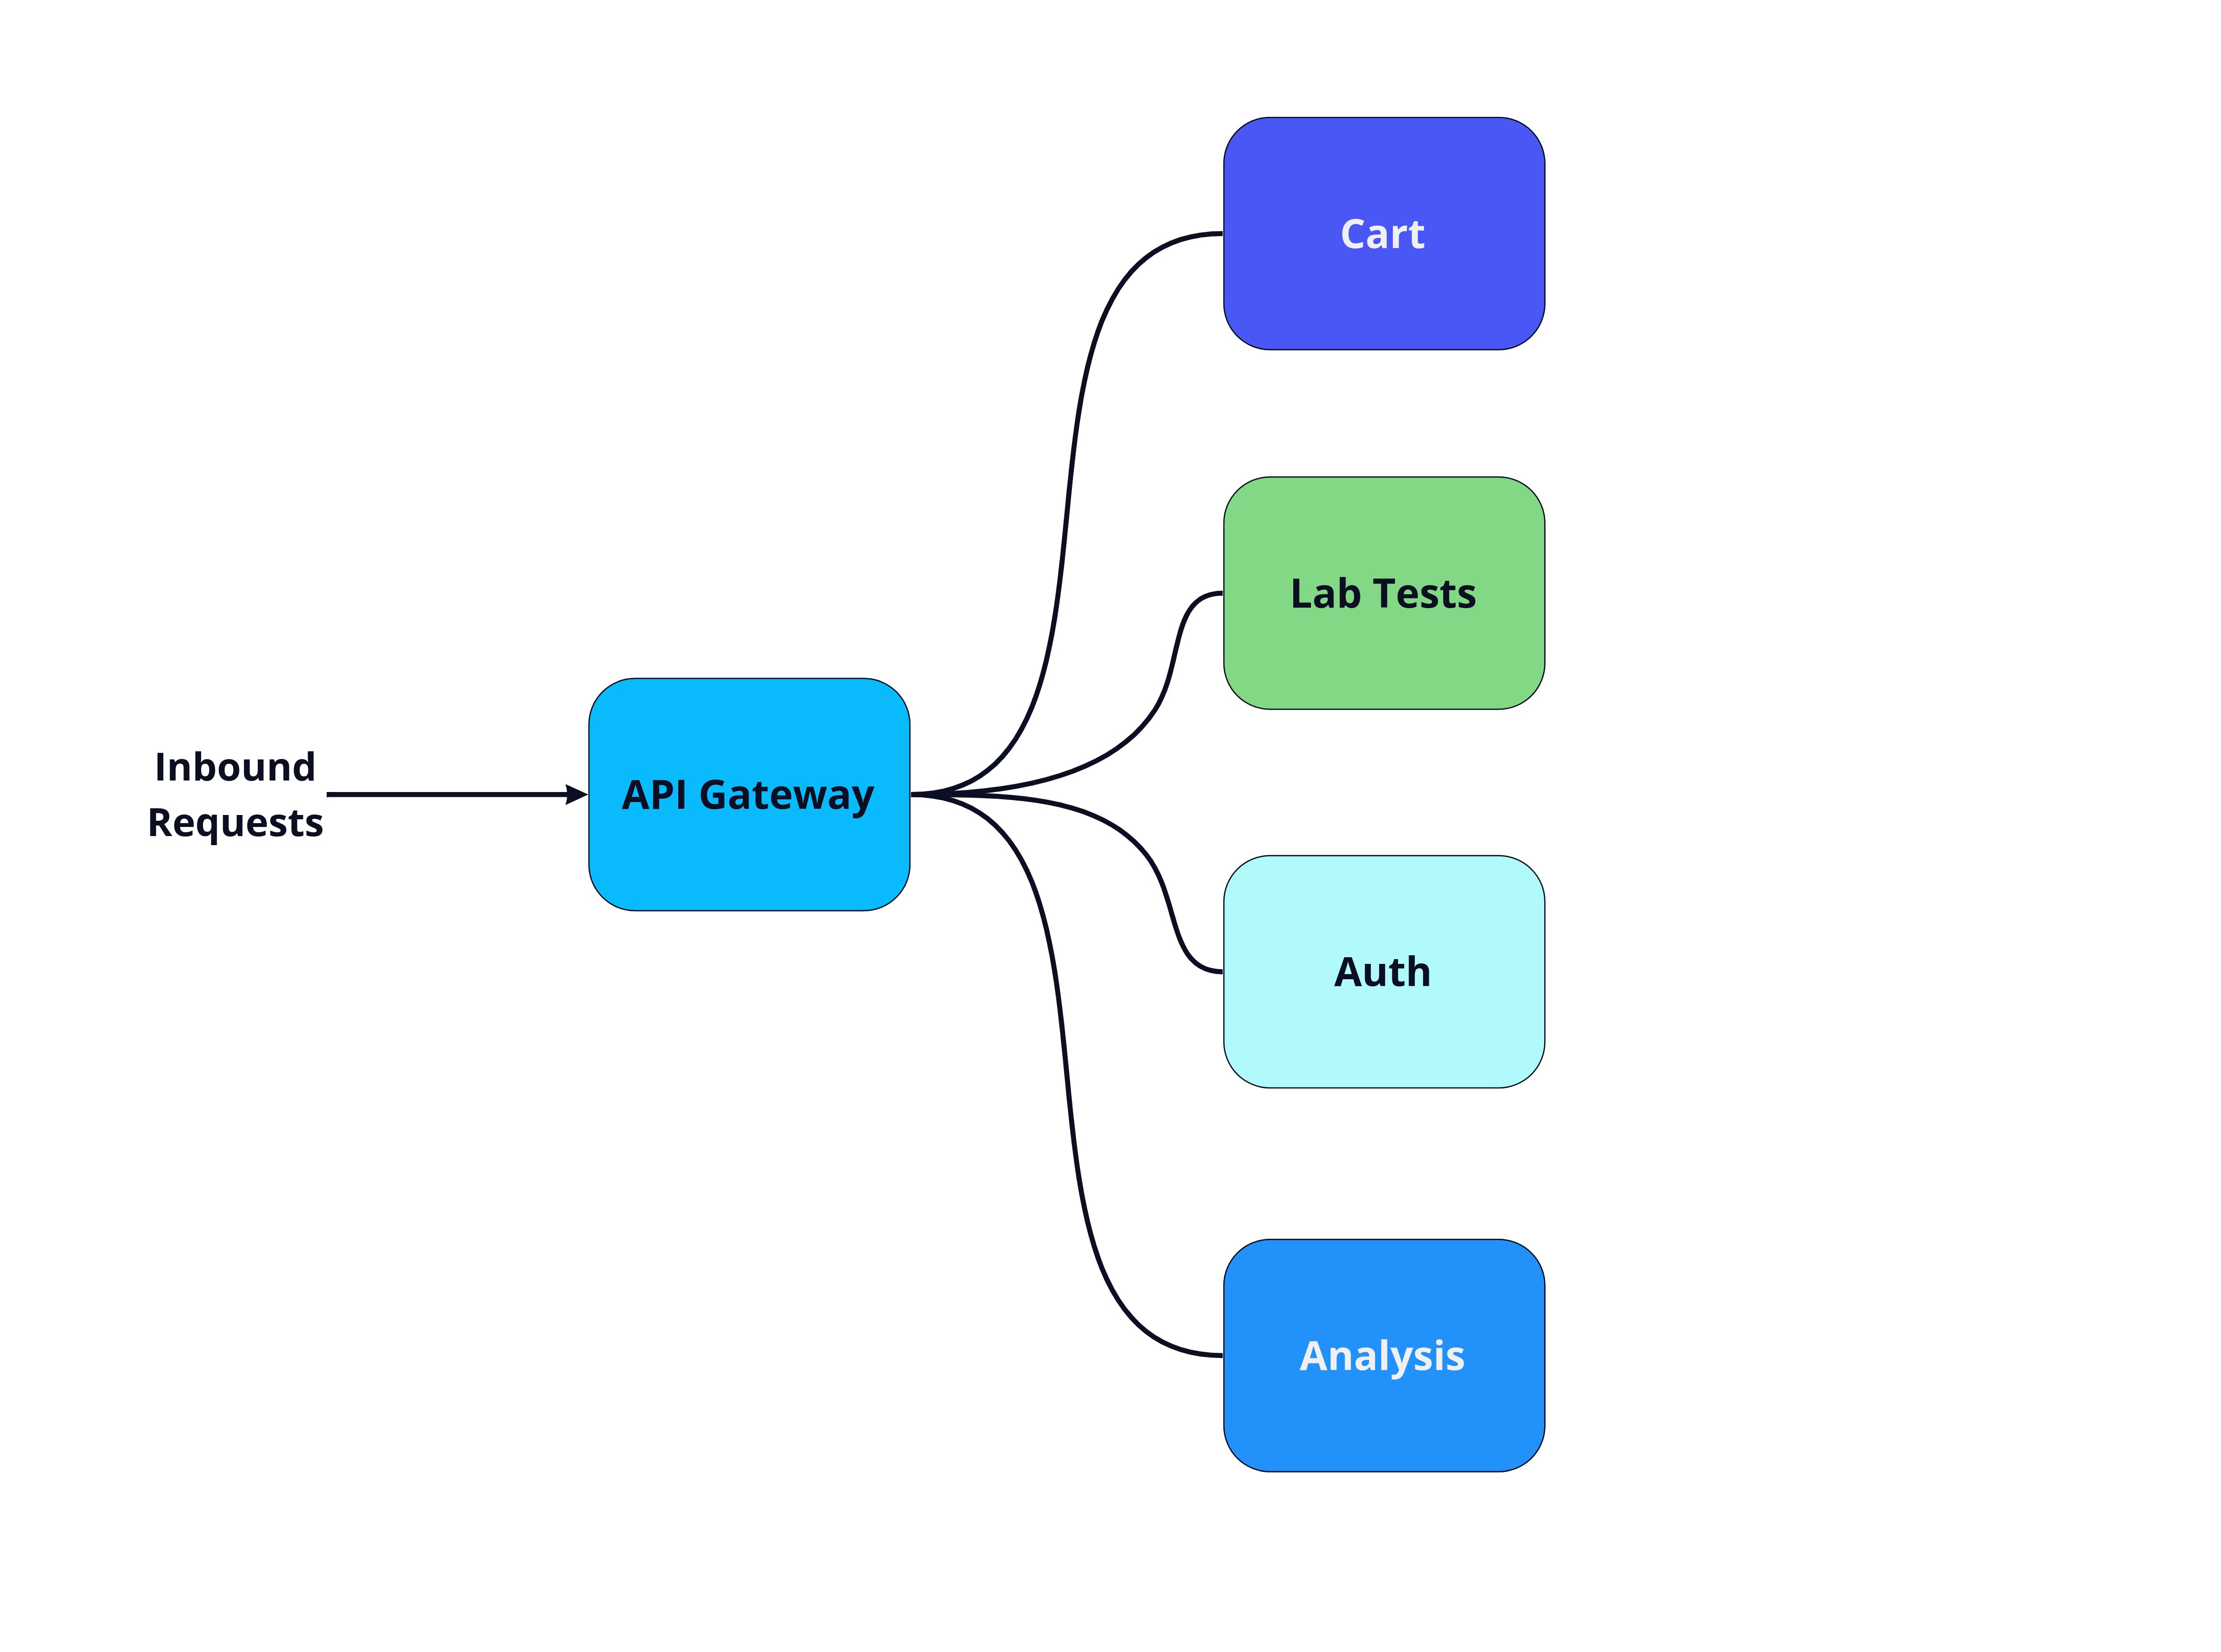
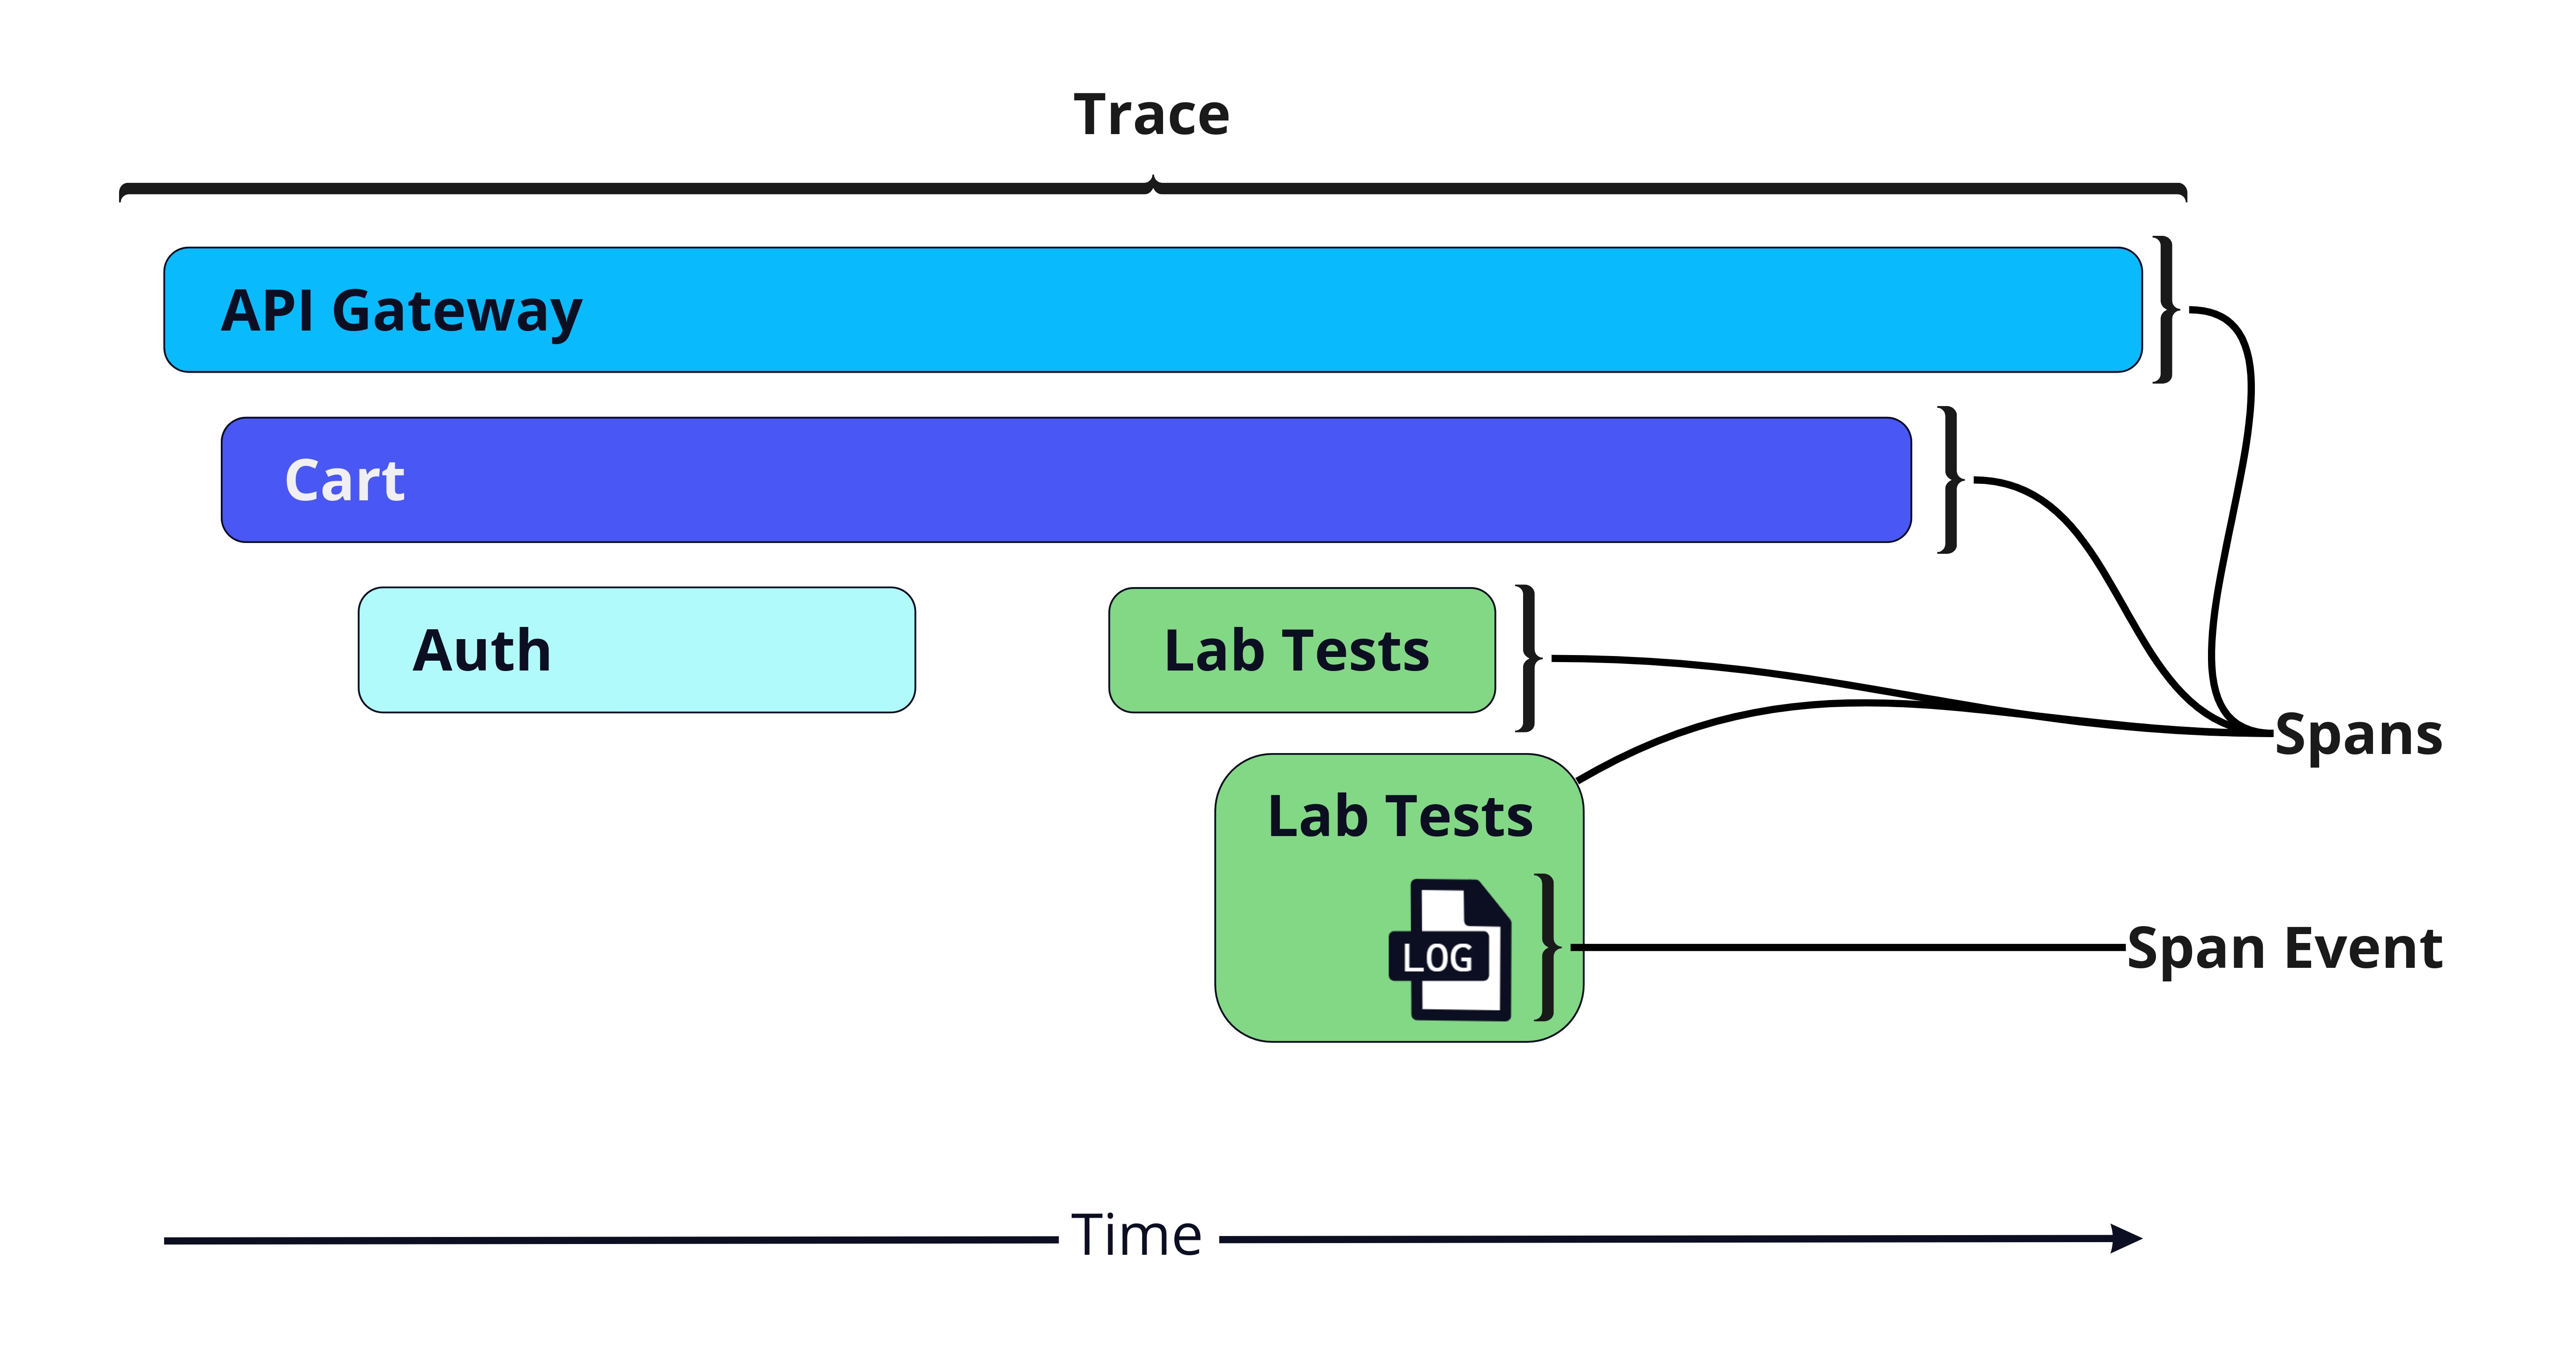
Although we understand the connections between components of the system, we cannot see how a specific request travels through the system over time. To do this, we can use a distributed trace, visualized as a waterfall diagram:
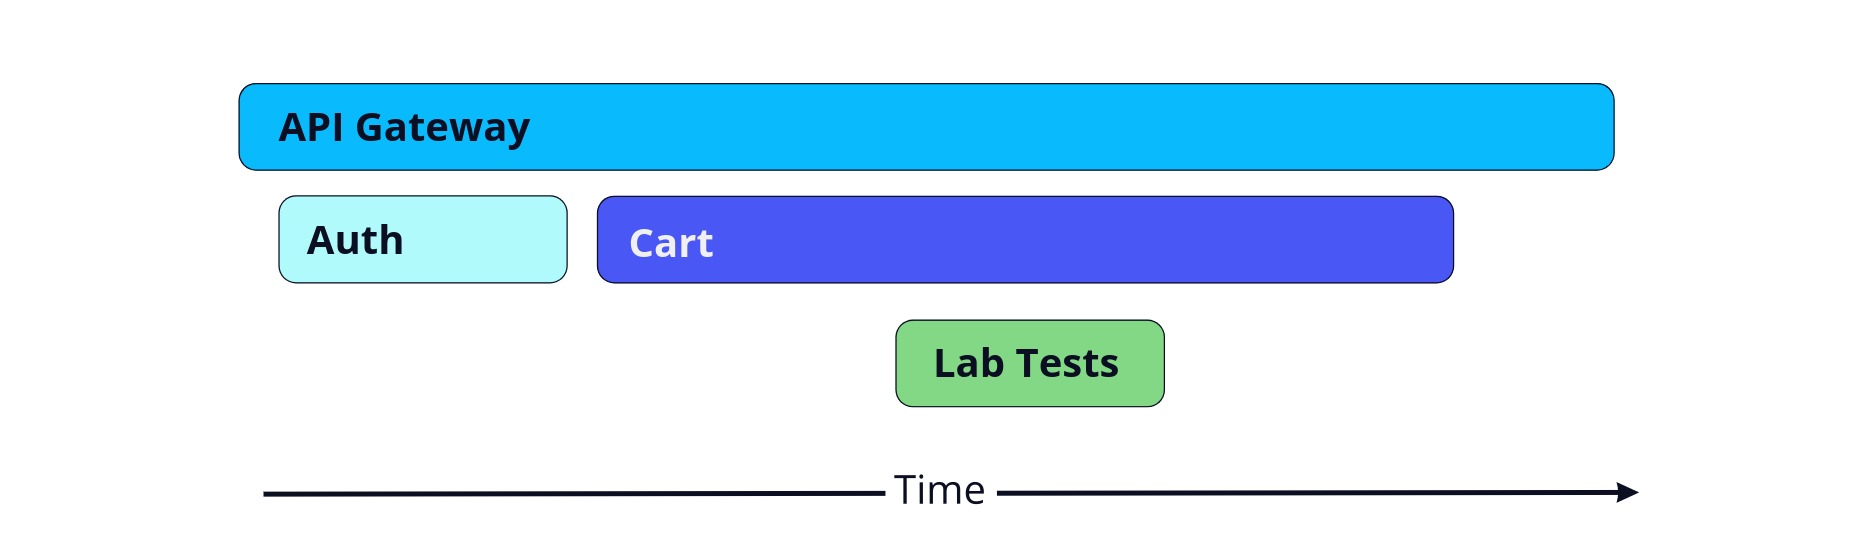
The trace begins in the top left of the diagram showing that the request begins with the API gateway. A trace is composed of spans, each representing a unit of work and the time taken to complete that work.
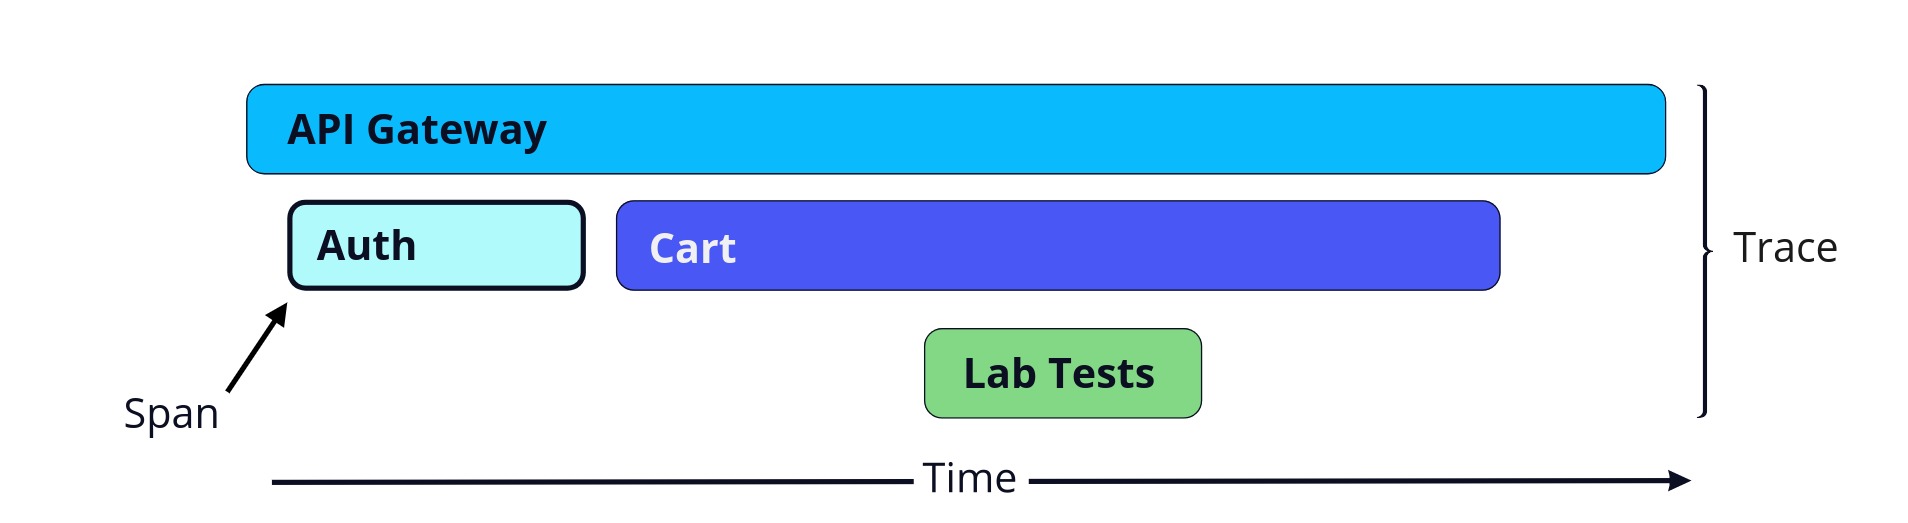
Not only can we easily see the length of a span, we can also see how calls to various services are related to each other. Here, the API Gateway calls the Auth service and then the Cart service, which in turn calls the Lab Tests service. All these spans together make up the entire trace.
3. Challenges With Logs and Traces
To help illustrate the use case that Hypha addresses, we're going to tell you the story of Labra Cadabra, a fictional health-tech company. They provide a platform for patients and diagnostic labs to handle payment, scheduling, and viewing test results.
3.1 Using Logs Locally
Amy is a senior engineer at Labra Cadabra. Here she is working on her local computer, adding a feature to their application.When she tests the new code, she finds that a certain input is producing a different output than she expects.Looking only at the output, it's not obvious what's wrong.
She can use logging to understand why the code is behaving this way. She writes a few lines of code to output the extra information she needs. In other words, she instruments her code to emit telemetry in the form of logs. She can use these extra details to pinpoint and fix the issue.
Now that Amy has fixed the issue, her code is ready to deploy to Labra Cadabra's production server. What will this mean for her ability to understand her code through logging?
3.2 Using Logs Locally vs. In Production
During development, Amy can add some logging whenever she wants to output some information. She can then rerun the program and see the output within seconds or minutes. Logs are often not saved since she is viewing them right away. Additionally, she doesn't need to put very much thought into the structure and format of the logs; since she just wrote the code that will output the logs, she has the context she needs to understand the information they contain.
In production, several things change. If an issue arises, any member of the team needs to be able access and understand the recent logs. Logs must be persisted and be output in a useful and consistent format. In addition, the time it takes to get new logging into the code has significantly increased. Amy can no longer decide she would like to log the value of a certain variable and see it on her screen a few seconds later. It is important that they make sure their code is well instrumented before being deployed, otherwise they might find they are missing key details needed to understand the state of their application.
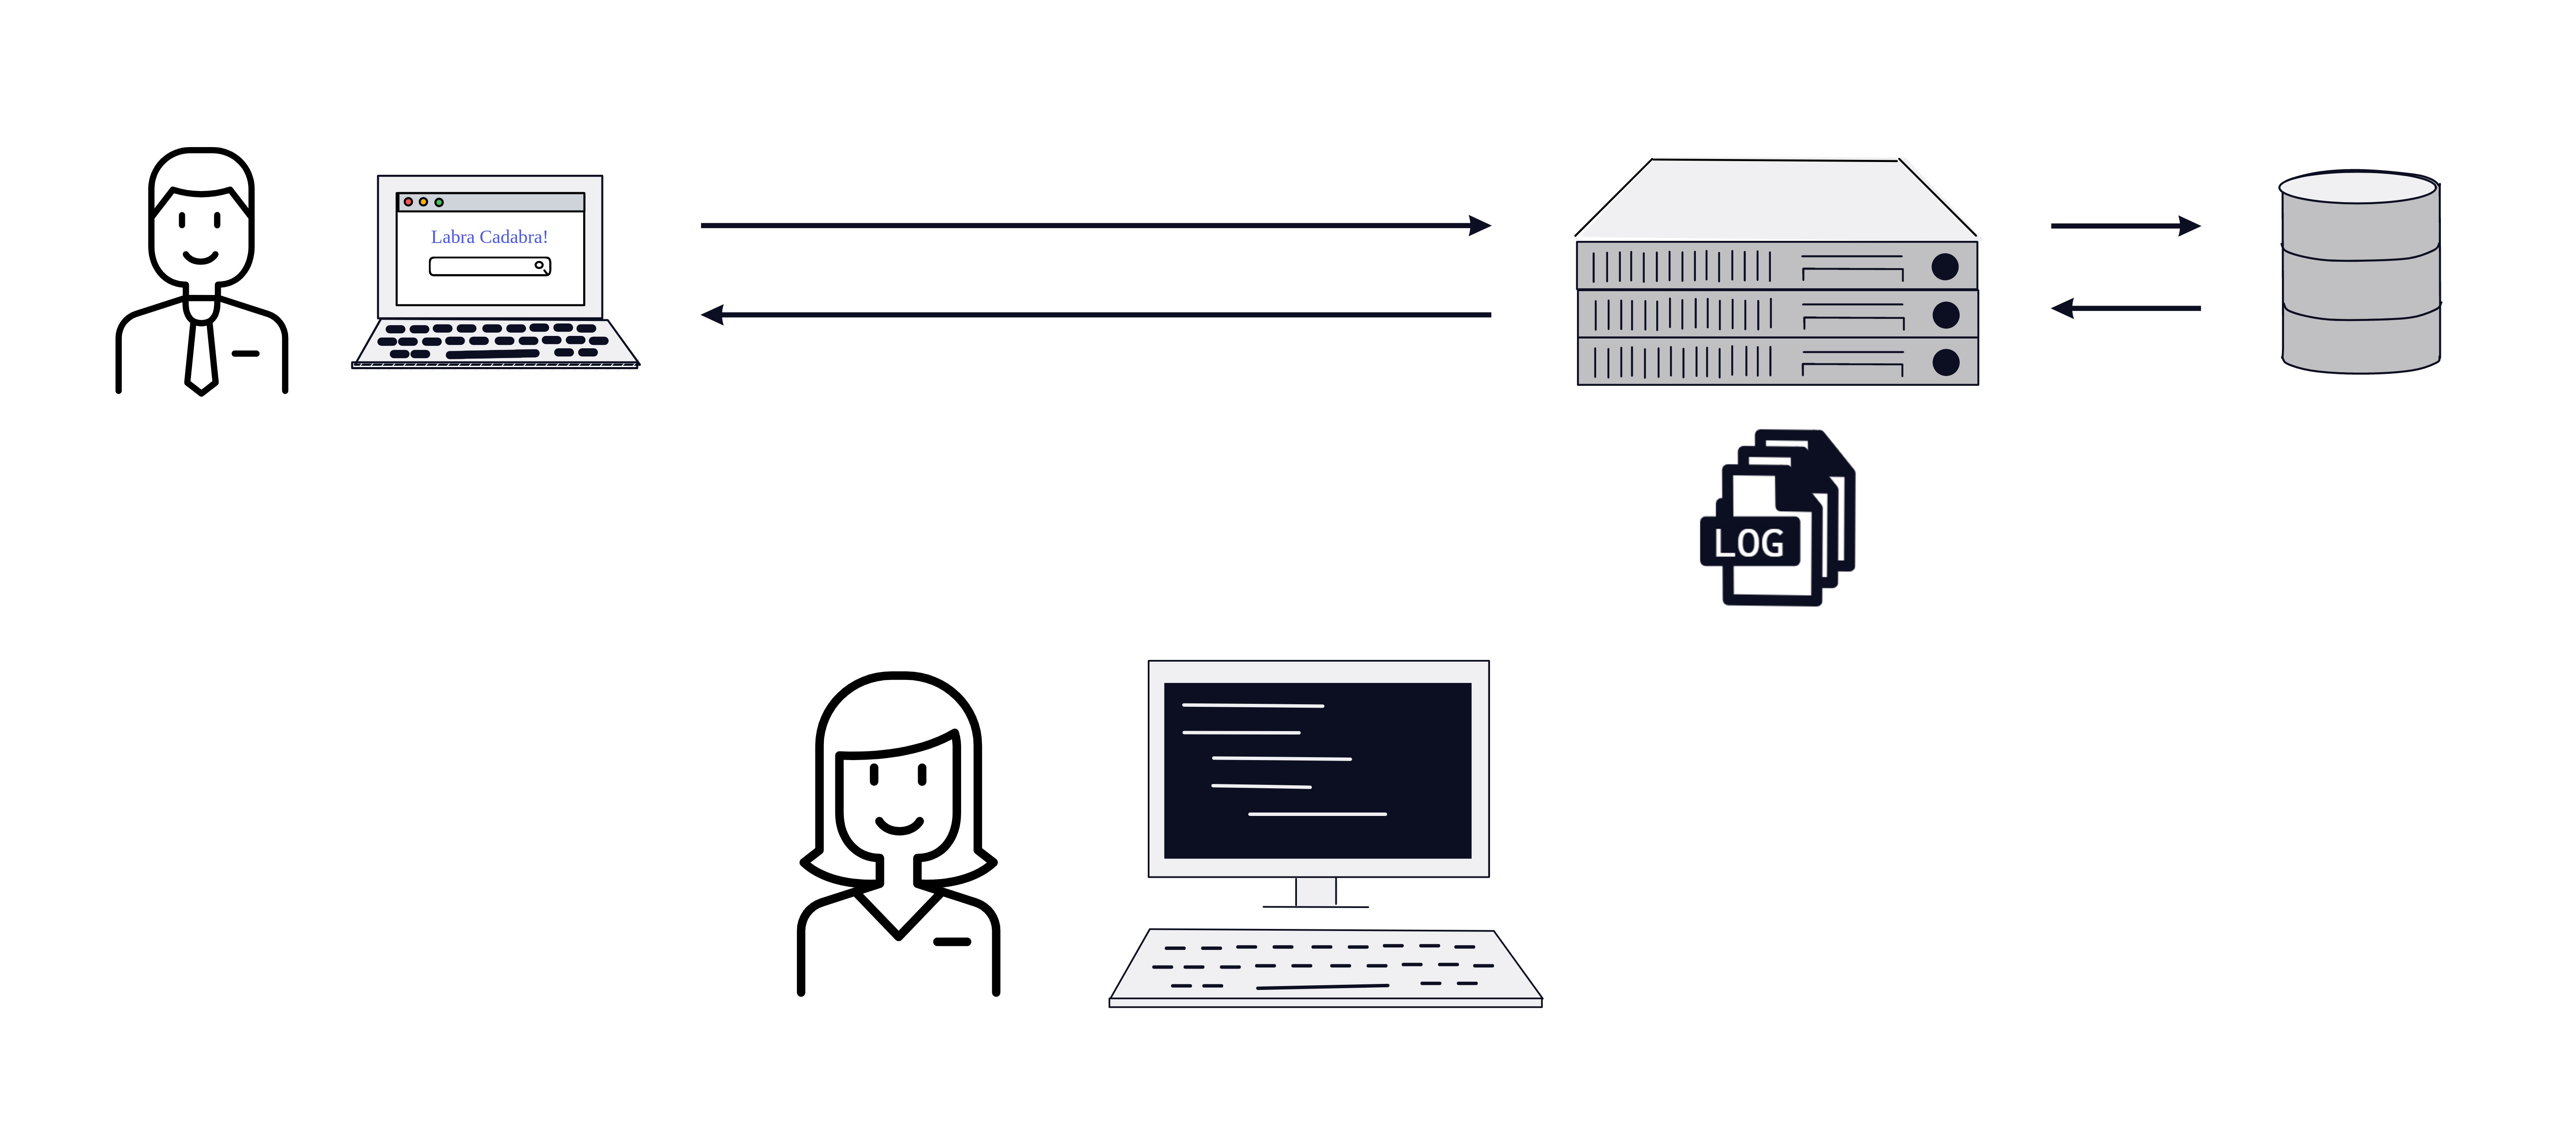
Amy has instrumented her code to output logs to a file on the server. When she receives a report of an error, Amy SSHs into the server and reads the log file. She can use Unix tools like grep to search the logs or tail to view the most recent logs. The Labra Cadabra team invests time and effort in making sure they are logging useful information. This investment allows them to effectively debug issues when they arise.
3.3 Using Logs in a Distributed System
As Labra Cadabra grows, they decide to move to a microservice architecture. It has several benefits:
- Services can scale individually with demand, allowing better resource utilization
- Each team can focus on a service, meaning they can be responsible for a smaller codebase
- Teams are more independent, meaning they can make technology choices that are best for their service
Of course, like everything else in software engineering, this comes with tradeoffs and challenges. In particular, there are challenges with regards to observability for distributed systems. Let's take a look at the challenges that Amy and her team would encounter using logs to debug a distributed system.
Challenge 1: Logs are distributed across nodes
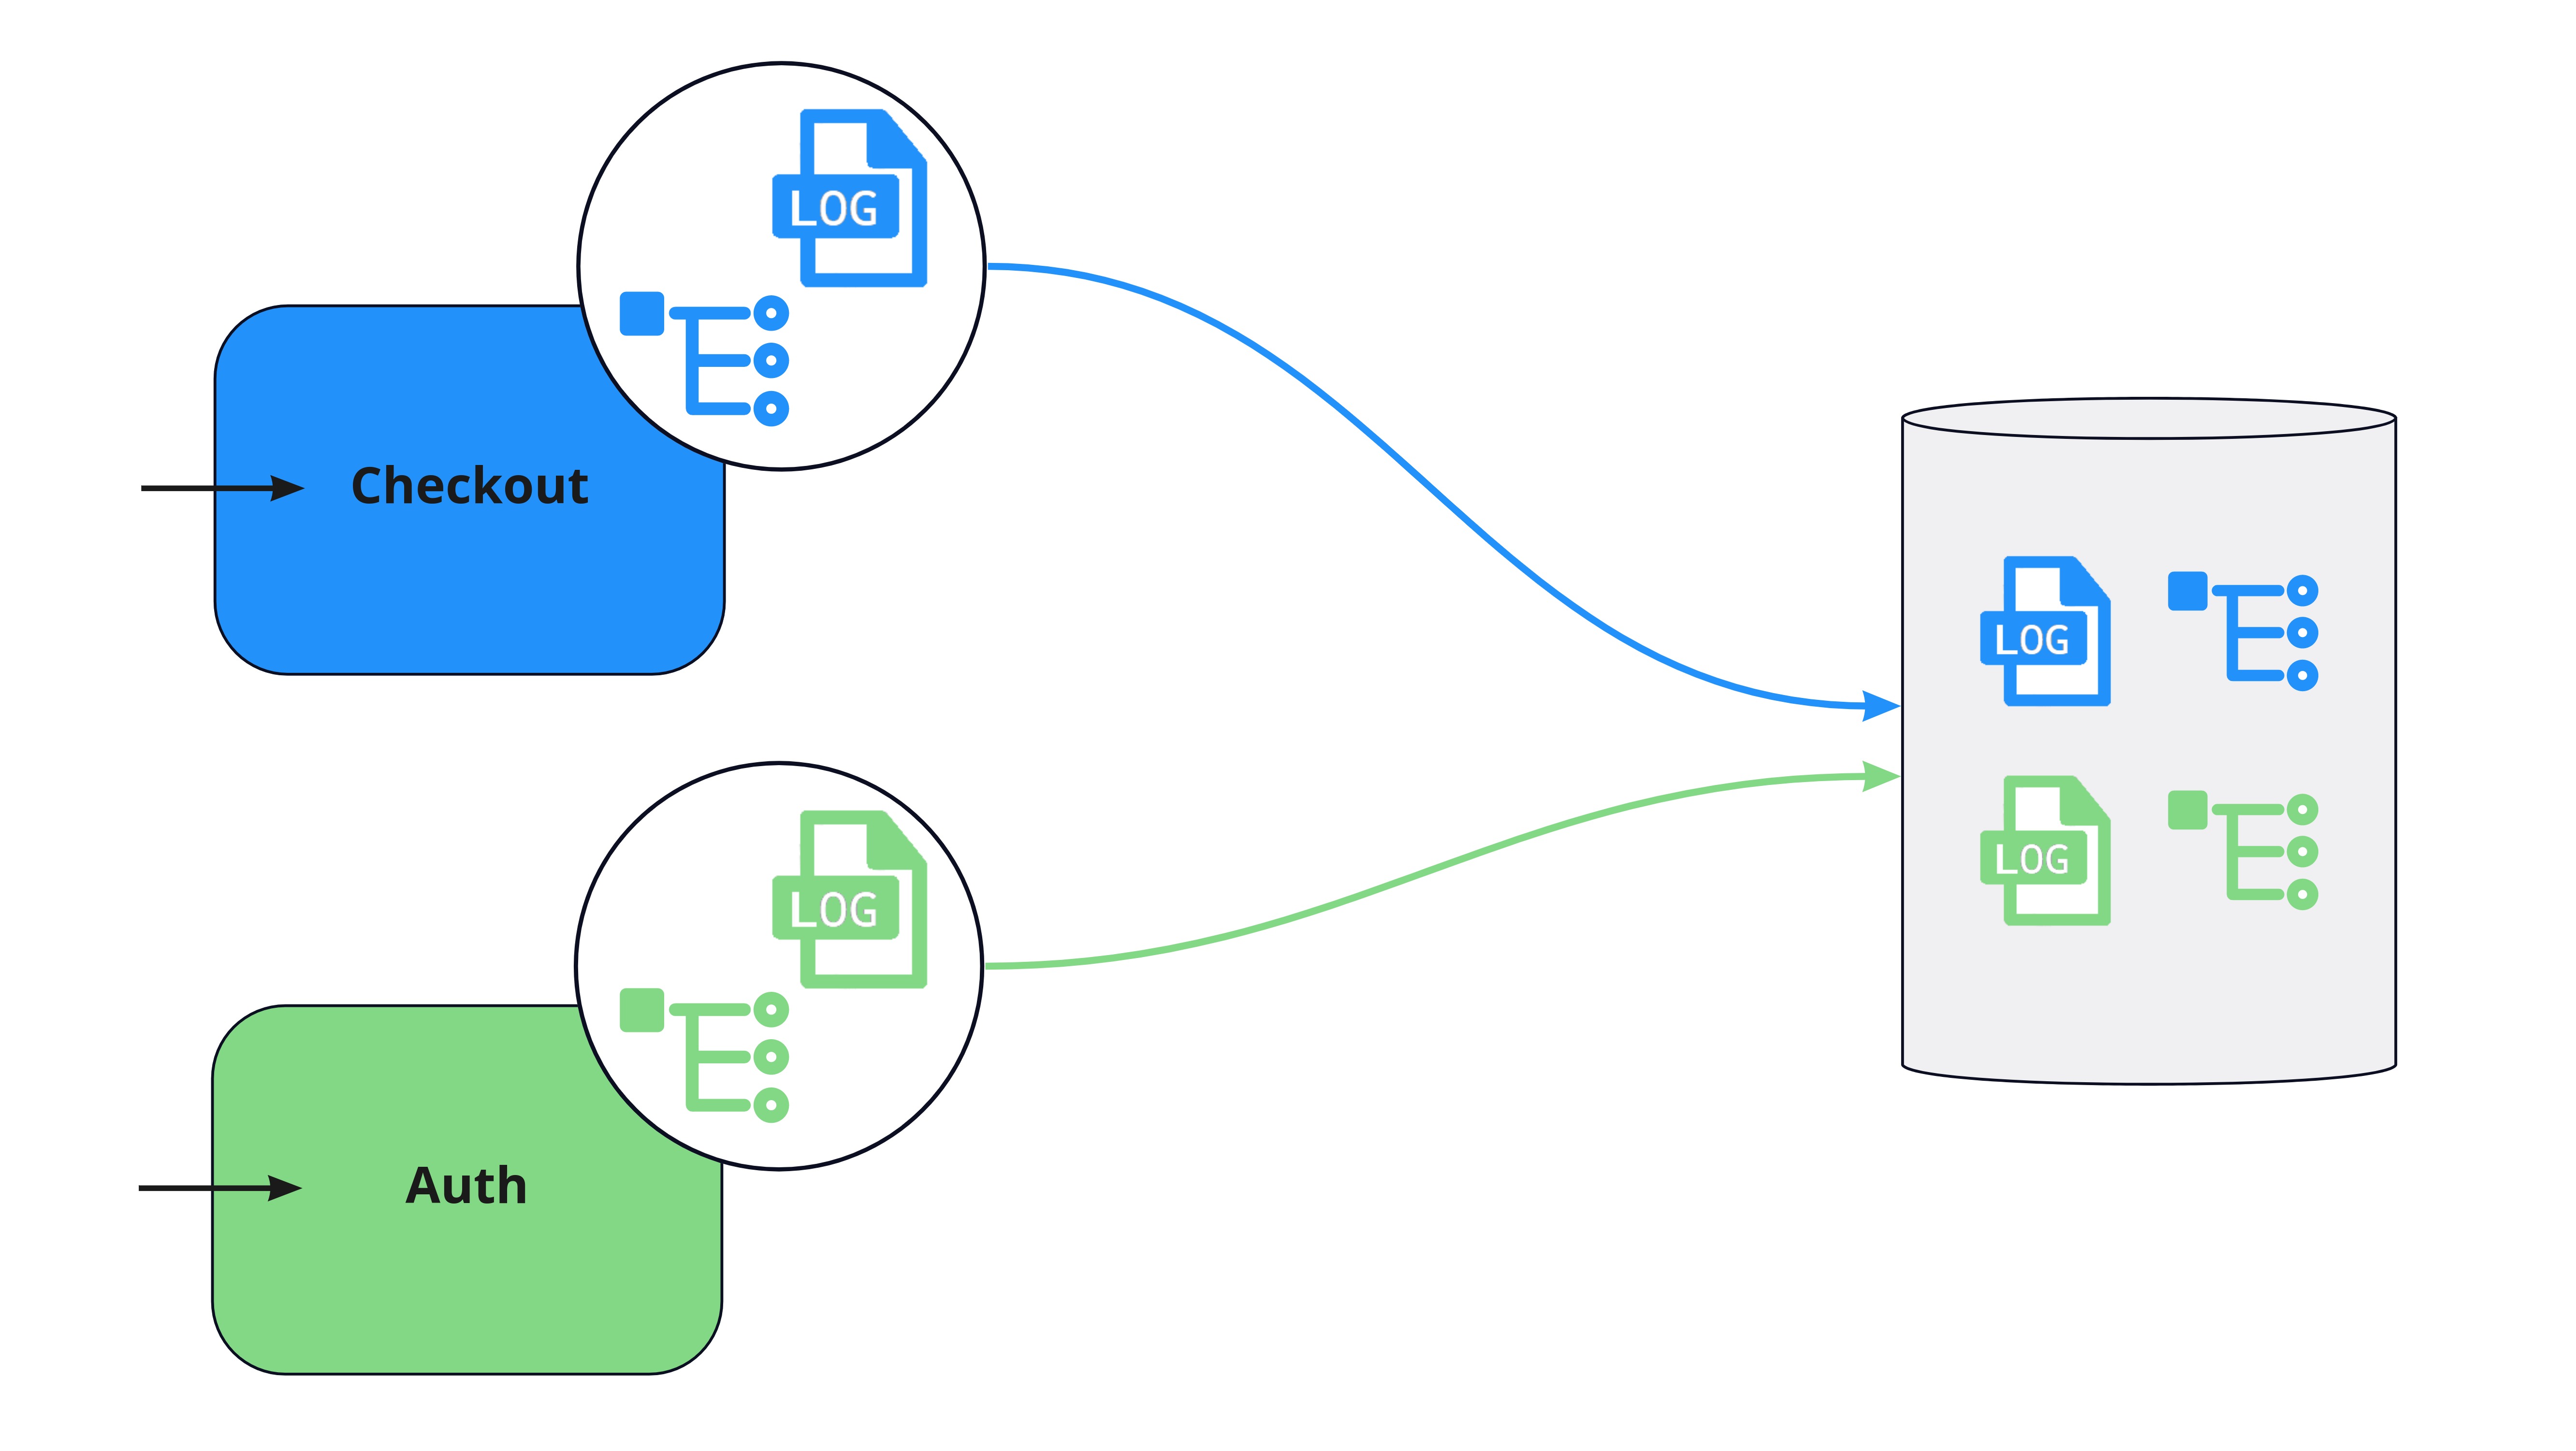
Previously, Amy could SSH into one server to find the logs she needed. Now that services are separated, many nodes produce logs and it is tedious to SSH into each service, slowing down debugging. One solution is to aggregate logs in one place, which allows the team to find what they need in one location, making debugging quicker.

There are several ways to do this. They could change their logging instrumentation to send logs over the network to a central storage solution, or they could install a separate program that scrapes and ships logs from the log files they're already using.
Challenge 2: Connecting logs from the same transaction
Having a centralized location for logs will speed up debugging for Labra Cadabra engineers. However, there will still be challenges with finding the logs they need in any given scenario. A single request from a user can touch and generate logs in many different services but there is no automatic connection between all of the logs produced by that transaction.
Imagine that Amy has received reports of an error when users are checking out, and she finds a log in the Cart service that has an error.
Amy would like to see all the logs that are part of the same transaction, because there may be additional valuable information in the Lab Tests or Analysis services even if they have not produced an error.
However, without a single piece of correlating information, it can be really difficult to find these. She could use things like userID or timestamp to narrow down the logs, but these won't be specific enough to show the logs belonging to a single request's journey: the same userID could belong to many requests, and many requests could occur in the same period of time. [3]

What Amy and her team need is a single ID that can be attached to every log that is generated as part of a single transaction. If they had this, Amy's search would be as simple as finding a log with an error and then using that transaction ID to filter the logs in all other services.
This idea of passing an ID along to each component in a transaction has a name - context propagation. [4] In her research, Amy finds that properly implementing context propagation is difficult. However, she also discovers that context propagation is one of the primary problems solved by distributed tracing. Amy could use the context propagation provided by tracing to connect all of their logs from a single transaction. In addition, distributed tracing will help give them another dimension of observability that they can't get from logs alone.
Challenge 3: Getting a high-level view of a request
Let's take a moment to understand how logs fall short when debugging a distributed system - even in a system that has log aggregation and context propagation. Recall that logs capture details about a point in time. For instance, imagine that Amy gets all the logs for a single transaction:
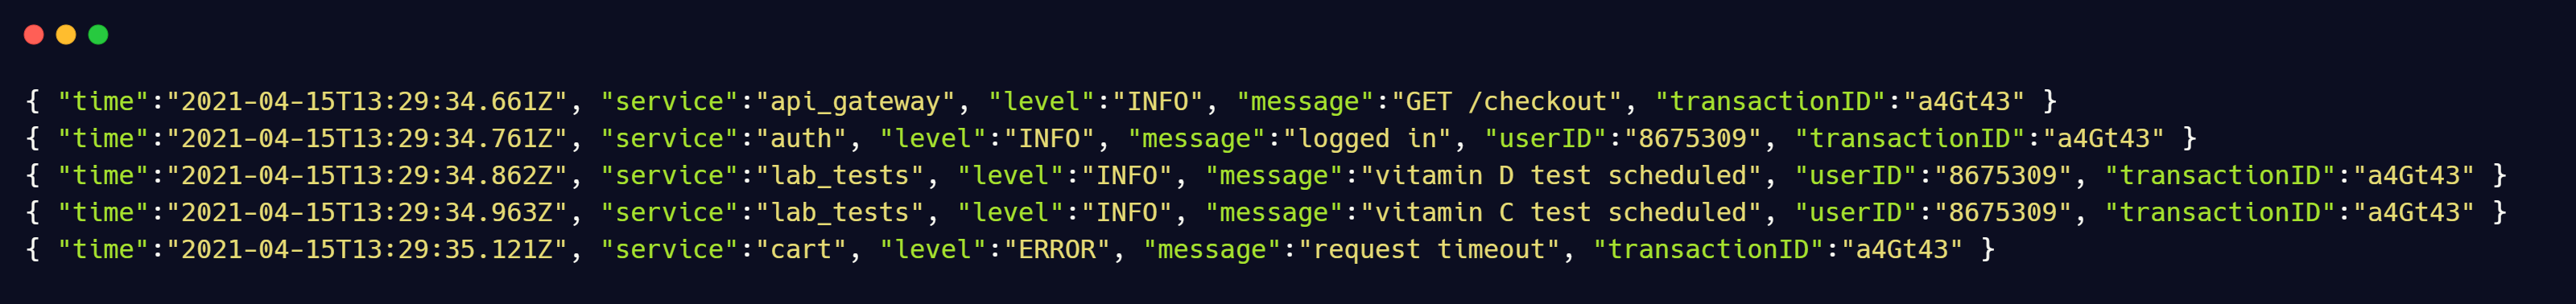
While these logs contain information needed to debug an issue, it is difficult to use them to get a high-level picture about things like latency and how a request flowed through a system. Amy and other senior engineers have enough experience and historical context that they often have an intuition for which logs will be most interesting. But newer engineers lack this context and it can take a long time to find the source of the problem. They want a solution that will help everyone get context quickly.
Fortunately for Amy and her team, distributed tracing was developed to address this lack of context. A waterfall visualization of a trace provides a quick and intuitive way to understand how a single request moved through the system, including the time taken in each service. This makes it easy for anyone to quickly get context for how the system works and to quickly identify where problems are occurring. [5]
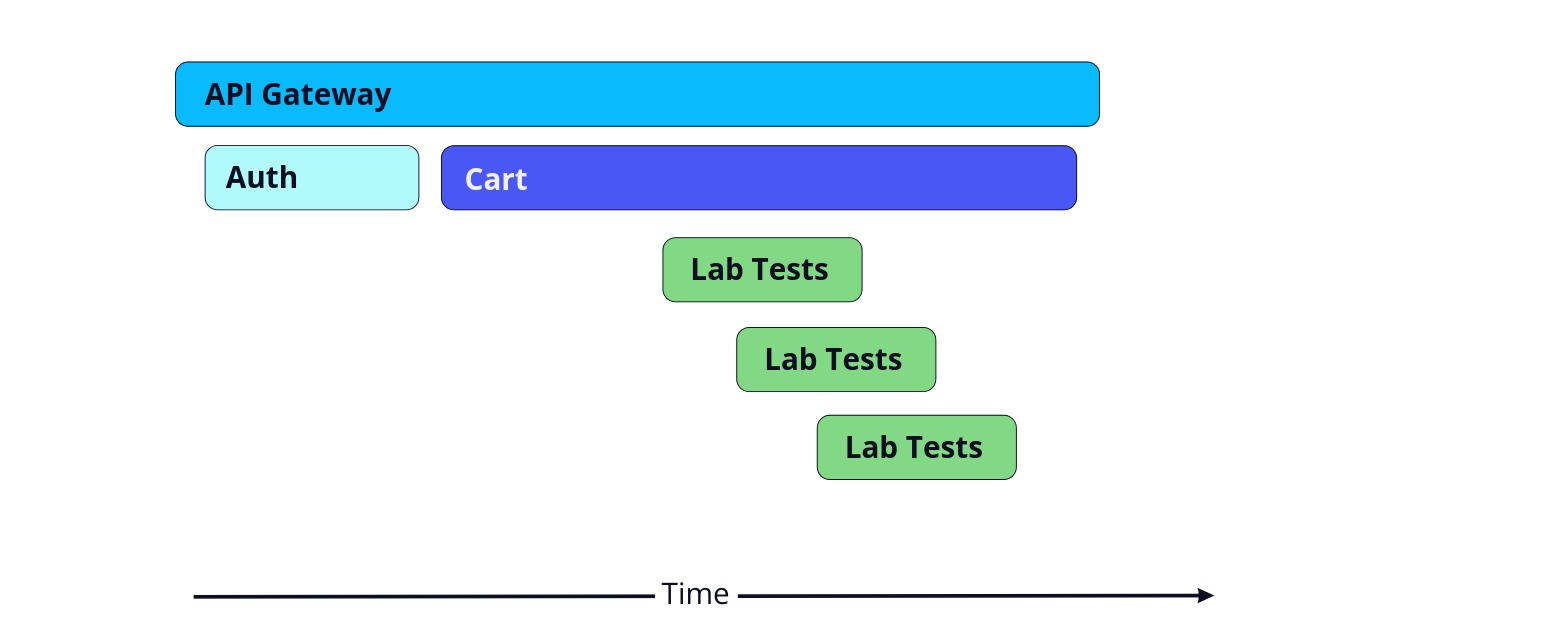
For instance, if Amy gets complaints about a delayed request to the cart service, she could browse traces that touch the cart service. She takes a look, and most of the recent traces look something like this.
But then she finds a few requests that look a little unusual:
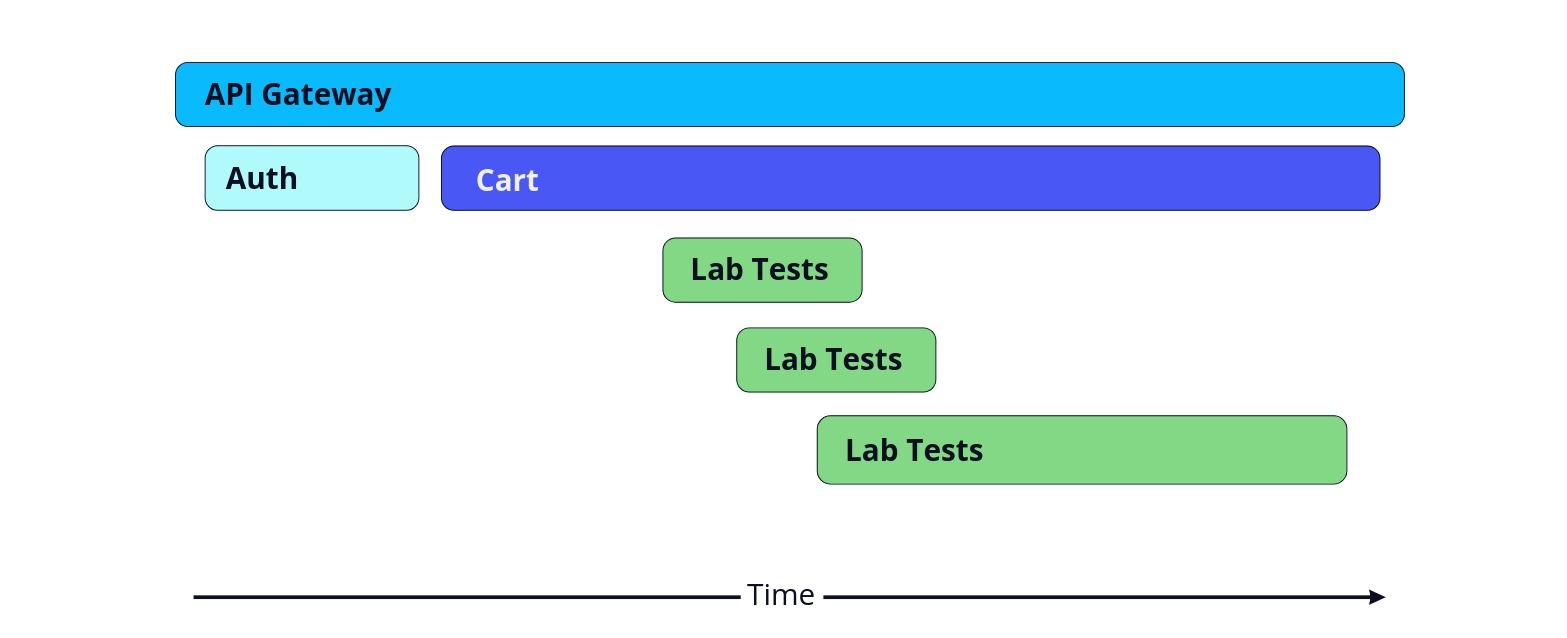
Immediately she can see that the last call to the lab tests service is a lot longer than the others, meaning that there may be a problem causing the lab tests service to respond slowly in this case.
Connecting Logs and Traces
Amy is starting to get a clear picture of what an observability system for their system would look like. Aggregating logs and using context propagation will make it possible to quickly find the logs they need. Using distributed tracing will allow anyone on the team to get insight into how a request flows through the system. Connecting logs and traces will allow engineers to flow back and forth between the macro-level view of traces and the micro-level view of logs.
To achieve this they will need a system that not only collects and correlates all this data, but also presents it in an intuitive, user-friendly way. Next we will take a look at what would go into a system that can do all this.
4. Telemetry Pipeline
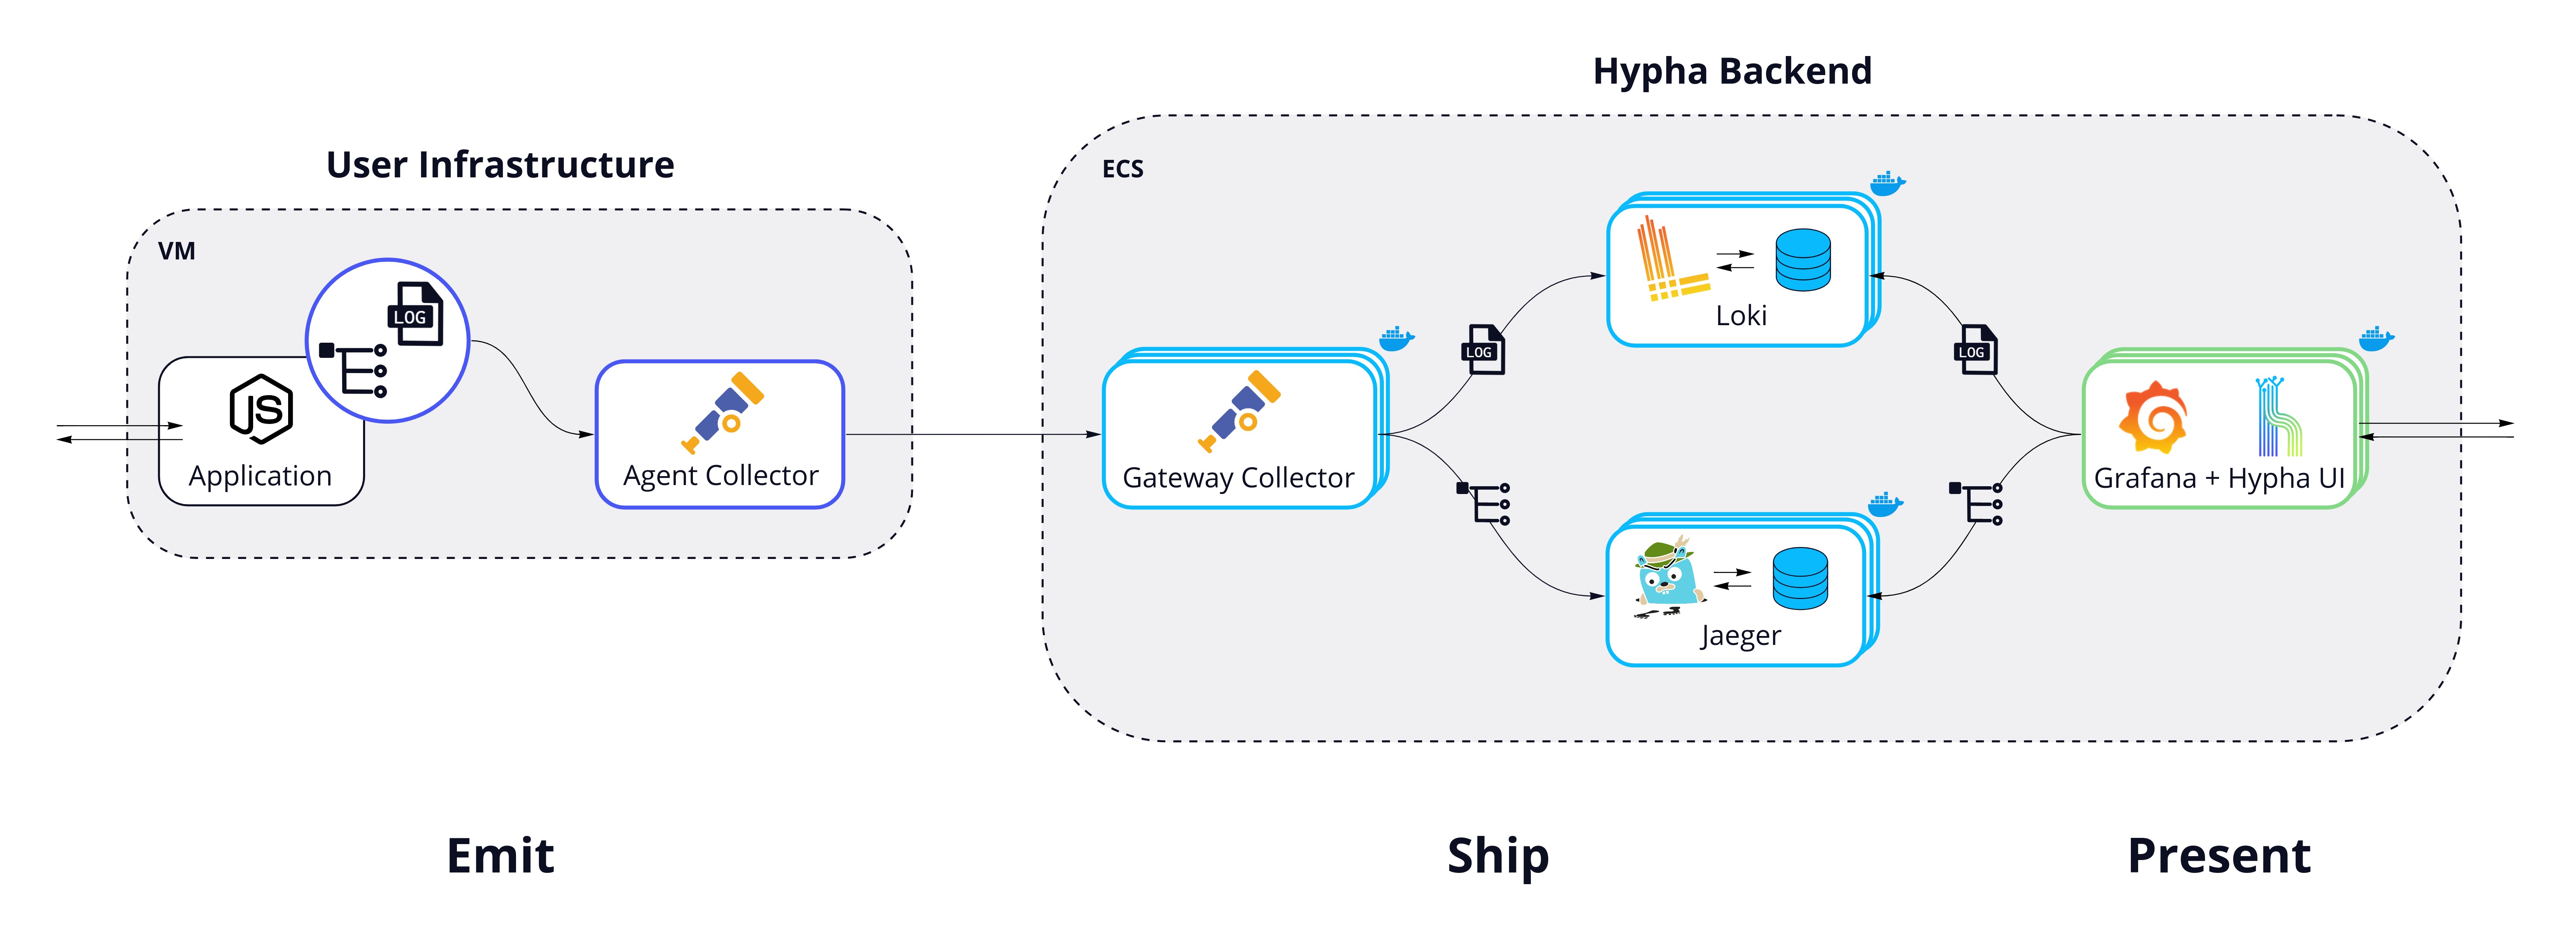
Let's get an overview of the major stages that compose a telemetry pipeline to have a better idea of what's involved before moving forward. We will use the model outlined by Jamie Riedesel in her book Software Telemetry, which describes three major phases: Emitting, shipping, and presentation. [6]
4.1 Emit
The emitting stage is where we instrument application code to generate the telemetry data that will be used in the pipeline.
To generate traces, one approach is to use an SDK from a framework like OpenTelemetry. When a new request hits the system, this code is responsible for generating the data needed to start tracing the journey of that request through the system. For application logs, a common approach is to use a logging library that generates and emits logs in a consistent, customizable format.
The emitting stage is also where we prepare the telemetry data for shipping. This preparation may include formatting or enriching the data with additional information. So, the approaches taken in the emitting stage will determine the initial format and content of the telemetry data before it enters the next stage of the pipeline.
4.2 Ship
The shipping stage is concerned with collecting the data that's been emitted, processing that data as needed, and storing it in a way that can be queried effectively.
Depending on the use case, this might also be where telemetry data is transformed or enriched to be more helpful. For example, we might want to parse data into a format that's better suited for the database we're using, or we might add contextual information that makes our data more helpful later on.
There are many other considerations in this stage, ranging from the type of storage we use, to how we aggregate and export our data, to how we process our data and why. All of these choices will have an impact on what we can do in the next stage.
4.3 Present
The presentation stage is focused on querying data from our storage and transforming that data in a useful way. This usually means visualizing data as charts, tables, and graphs, and providing a user interface to interact with the telemetry data produced and stored by the earlier stages of the system.
This is the stage that users of the pipeline are going to interact with and see the most. For example, this is where a developer would actually go to investigate and debug an issue.
Later on, we will take a deeper dive into each of these sections as we discuss the approaches we took with Hypha. For now, let's pick back up with Amy and her team as they investigate some of the existing solutions in this domain.
5. Existing Solutions
5.1 SaaS
They might start with software-as-a-service solutions, sold by third-party vendors.
One of the main advantages of SaaS solutions is that there's minimal setup required to use them. In most cases, a developer just has to copy instrumentation code into their applications, and the vendor takes care of all the other stages in the pipeline. They also manage that pipeline, so the developer doesn't have to worry about deploying, scaling, or maintaining that infrastructure. Finally, these solutions come with feature-rich UIs that can handle many data types and are highly customizable.
However, these benefits come with some drawbacks. First, by sending their data to a third party, Labra Cadabra would no longer have sole ownership of that data. As a healthcare company that needs to protect their users' privacy, this is a pretty big drawback to consider.
Another difficulty with using SaaS solutions is that the vast feature sets can be a double-edged sword. While very powerful, they can also be overwhelming and difficult to learn, and Amy and her team would like to start using telemetry data without such a steep learning curve.
5.2 DIY
Another approach they might look at is to use open source telemetry tools, which they could connect to create a DIY solution.
One of the major appeals of this approach is that by using open source tools, Labra Cadabra would have control over their telemetry pipeline. They could customize it to fit their needs, and update and expand their pipeline as needed. Labra Cadabra would also retain data ownership, since they would own the pipeline itself.
But this also comes at a cost. The biggest challenge with this approach is the sheer amount of time and effort required to build a pipeline this way. The above logos represent just a portion of the tools that can be used for telemetry. This is a constantly evolving field, and it can be challenging to stay up to date on what tools are best suited for different use cases.
Amy and her team would need to invest considerable time and effort in researching these tools. First, they would need to learn which tools fit their use case for each pipeline stage. Then, they would need to determine which of these tools are compatible. Once they've decided which tools to use, they must configure them to match their use case and make sure the tools integrate effectively.
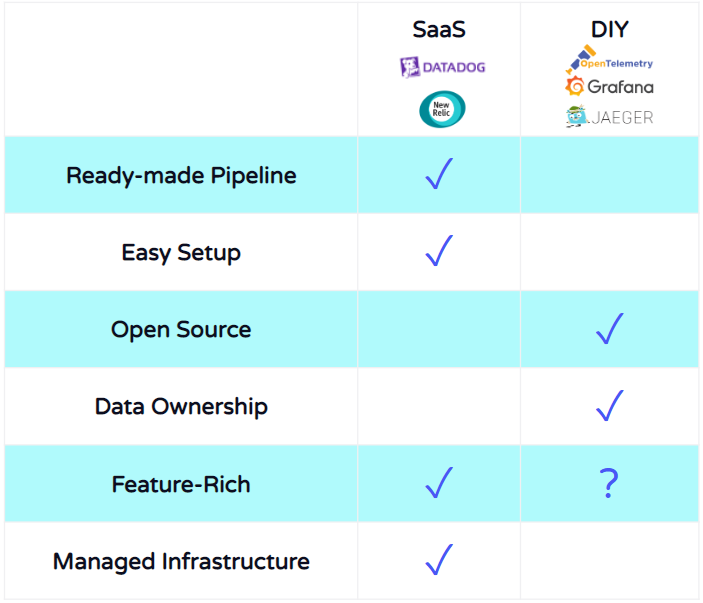
To review, SaaS solutions are managed and easy to set up, but the team wouldn't have control over the code, and they wouldn't have the data ownership they want. DIY gives them more control and ownership, but that control comes at a heavy labor cost. They'd like to have another way, and this is where Hypha fits in.
6. Hypha's Solution
Hypha was designed to combine the easy setup of a SaaS solution with the data ownership and control of a DIY approach.
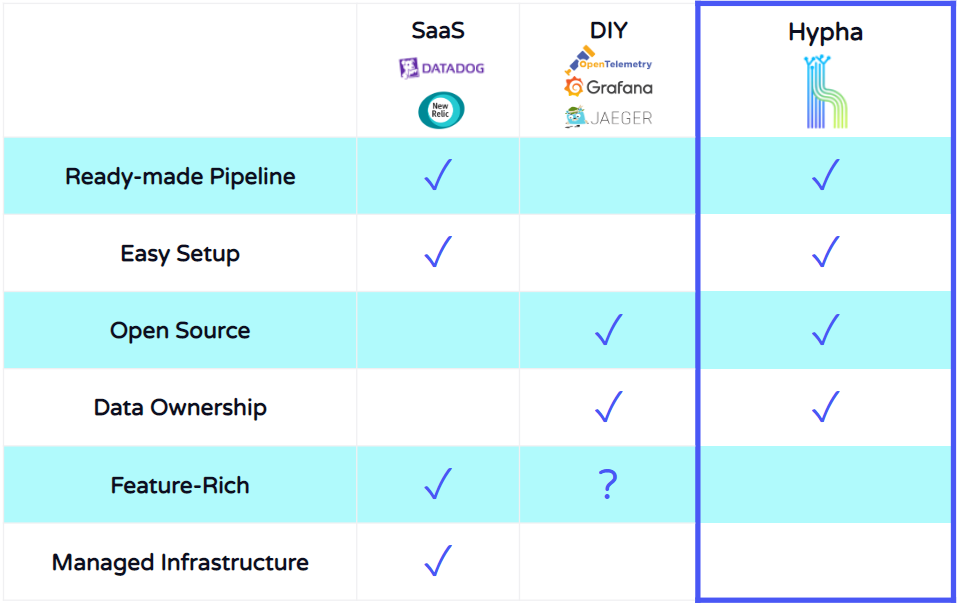
Hypha provides a ready-made telemetry pipeline, it automates setup and deployment processes, and it provides a UI that's easy to learn and start using. It's powered by Grafana, but packaged in a streamlined and pre-configured interface.
A tradeoff is that Hypha isn't as feature-rich as the SaaS solutions. But this is well-suited for teams looking for a tool that's easy to understand and start using. Next, we'll illustrate some of the main features of Hypha's UI to show how it facilitates an easier debugging workflow.
6.1 Using Hypha
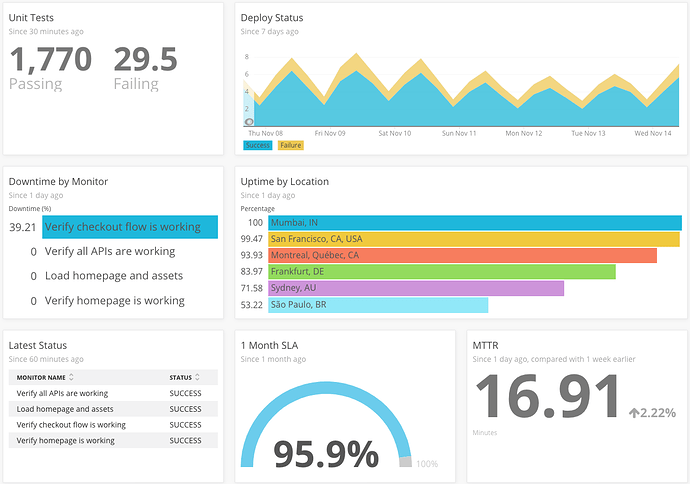
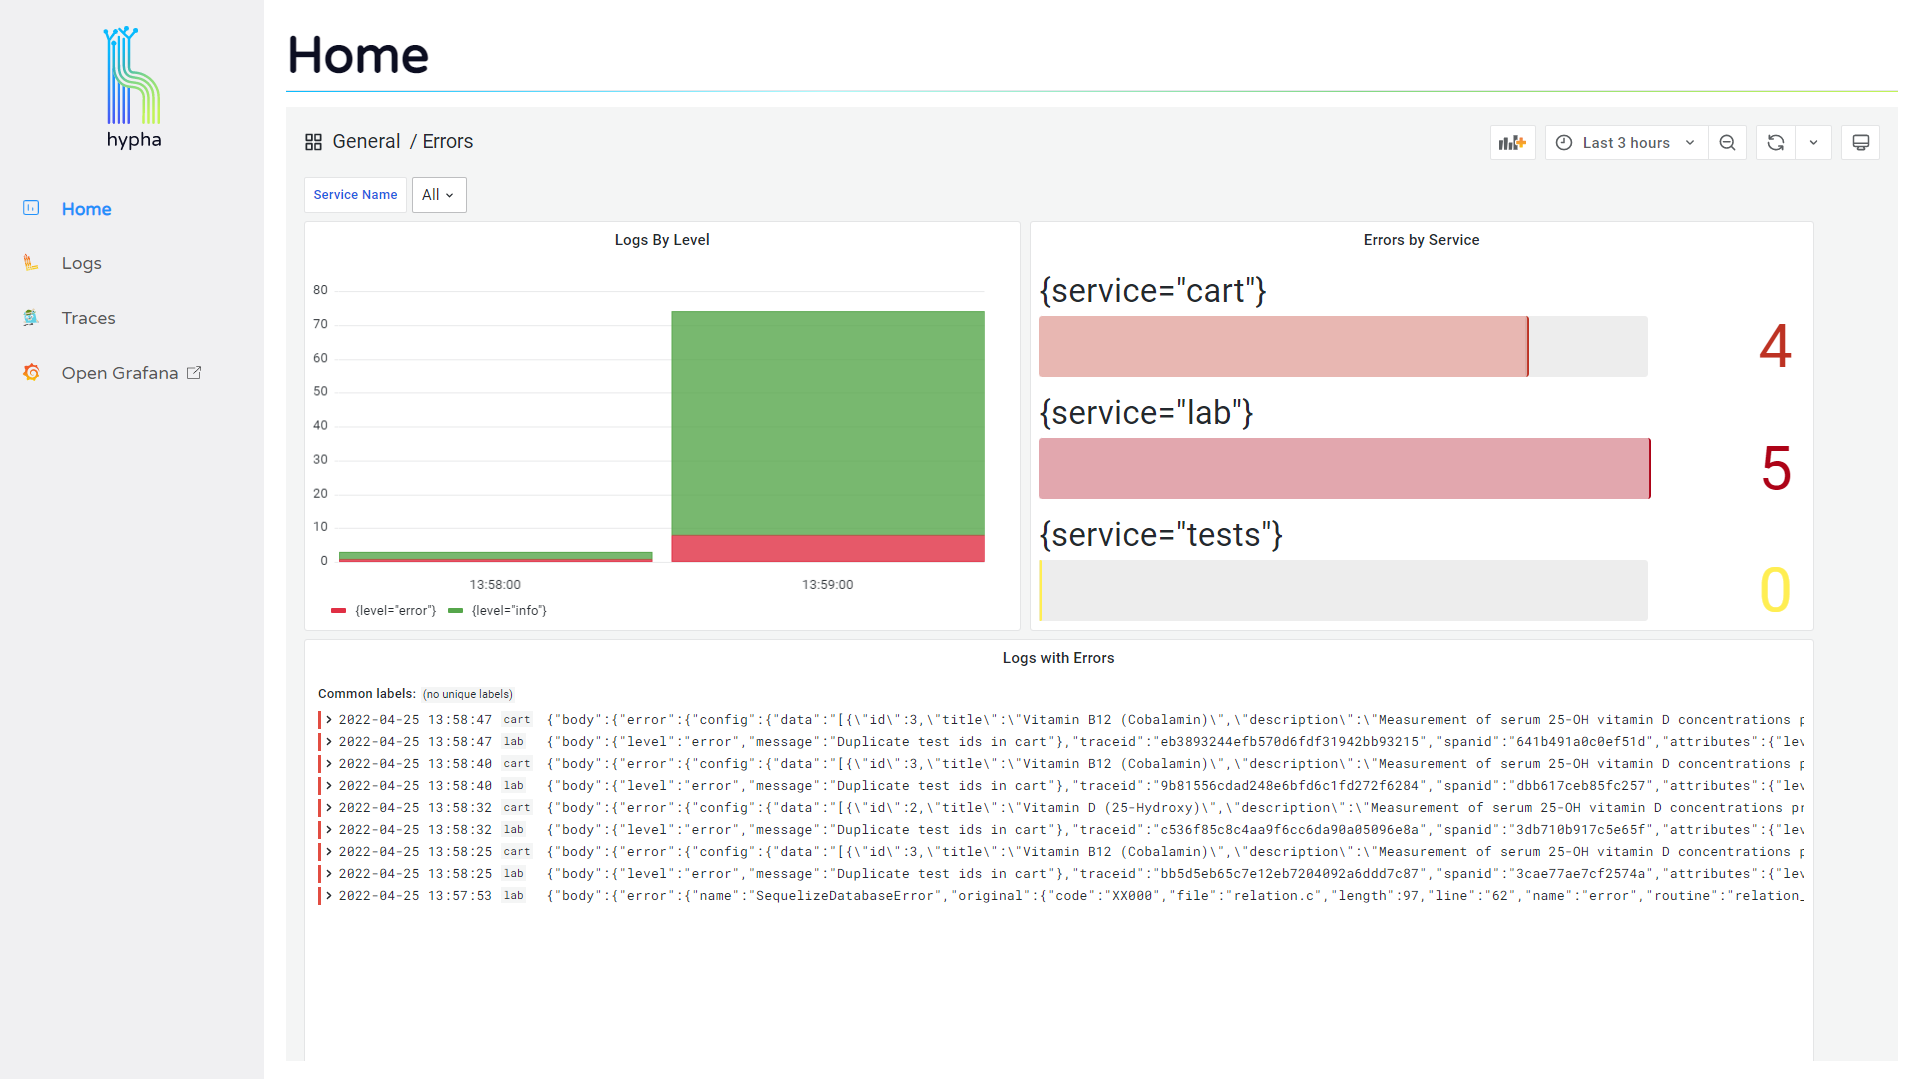
The home page visualizes error metrics by service, allowing users to quickly assess the health of their system and start investigating problematic logs.
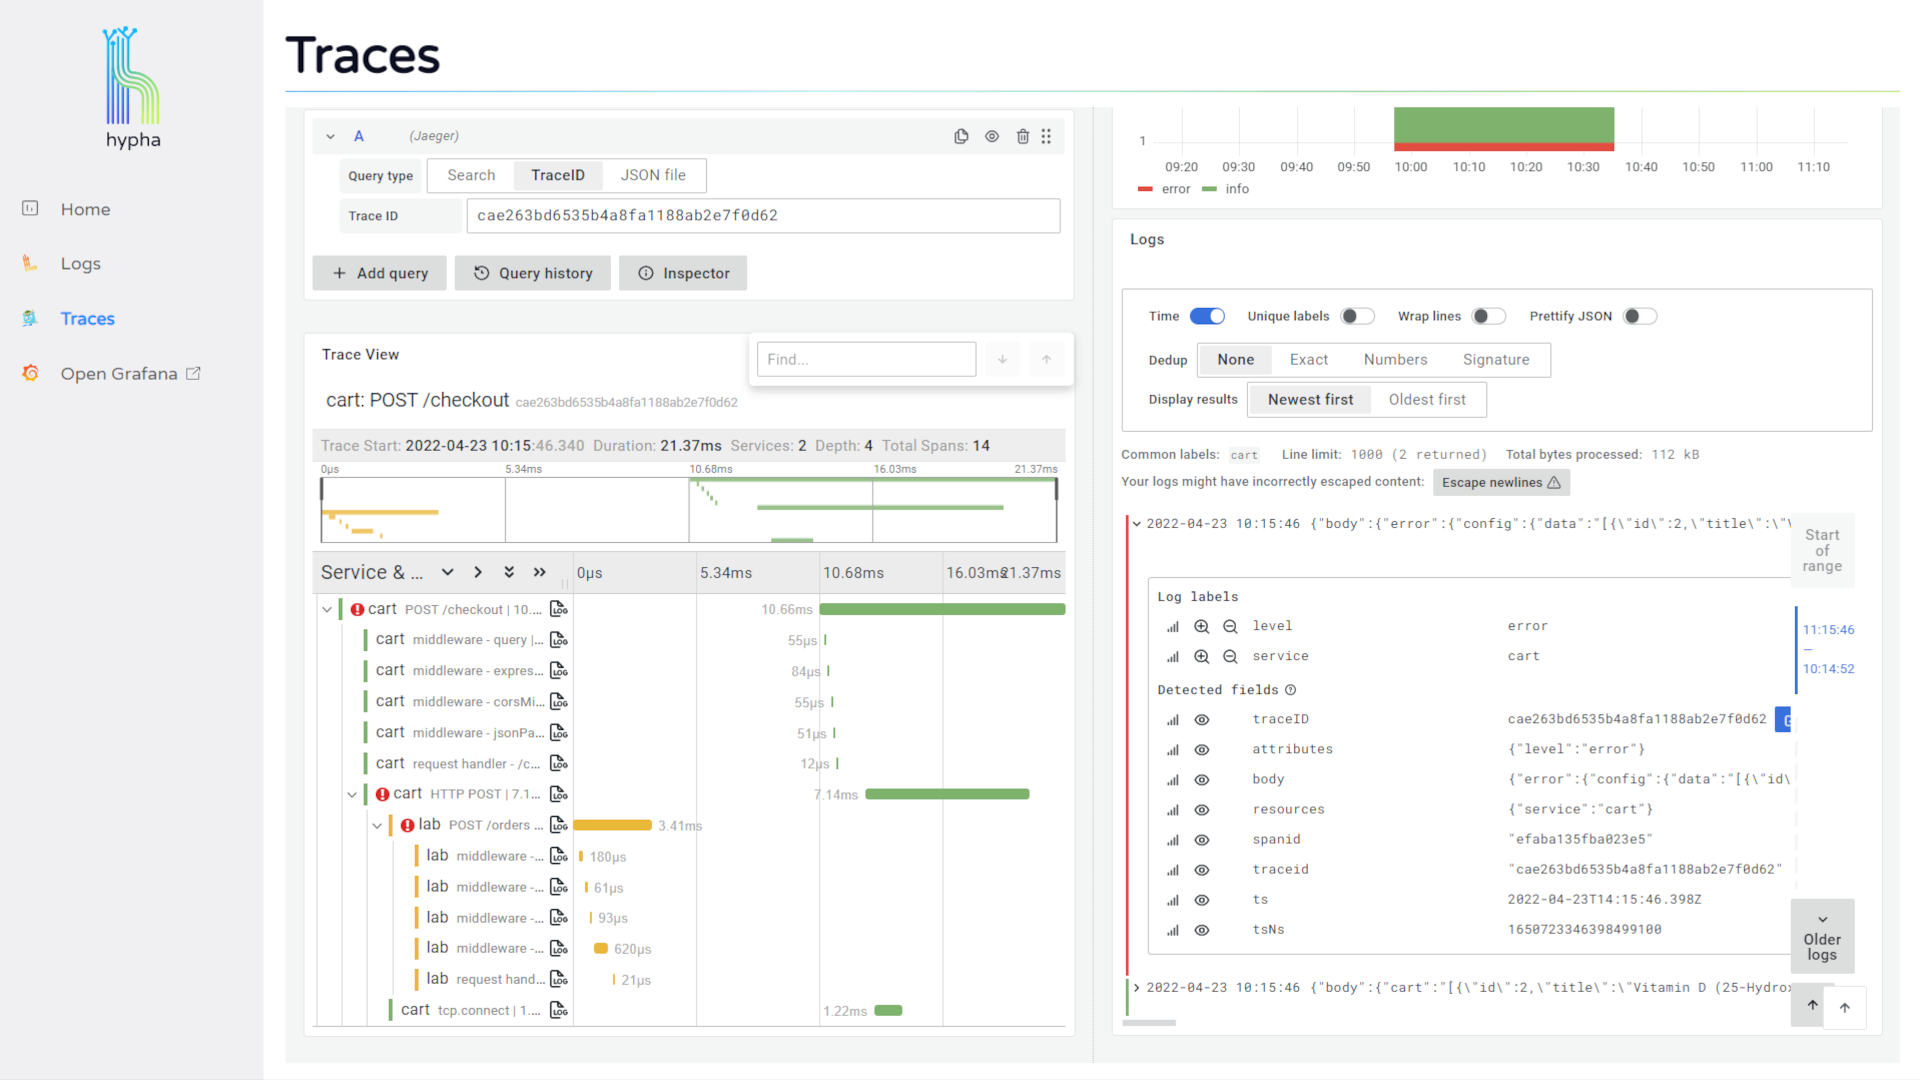
Users can click into their logs to see expanded detail, and this expanded view includes a "Jaeger" button that allows them to jump to the trace associated with that log.
The trace overview displays a waterfall chart representing the trace and its spans. Users can click into a span to see its expanded attributes along with a "Logs for this span" button.
Clicking this button opens a side window that displays the logs associated with that span. This provides users with immediate access to the detailed information provided by relevant logs, making it easier to continue investigating and debugging.
The Hypha UI correlates logs and traces within the same tool, and it facilitates easy access and movement between them. This makes the debugging process faster and more fluid, and it saves users the toil of having to manually correlate and search for their data in different places.
Hypha saves developers the toil of setting up this kind of solution with a DIY approach, which would involve many challenging steps at each stage of the pipeline. Next, we'll take a closer look at how Hypha approaches some of those steps, showing what tools we use, why we chose them, and how they work together. We'll continue following the 3 stages of a telemetry pipeline that were introduced earlier: Emit, Ship, and Present.
7. Hypha's Architecture
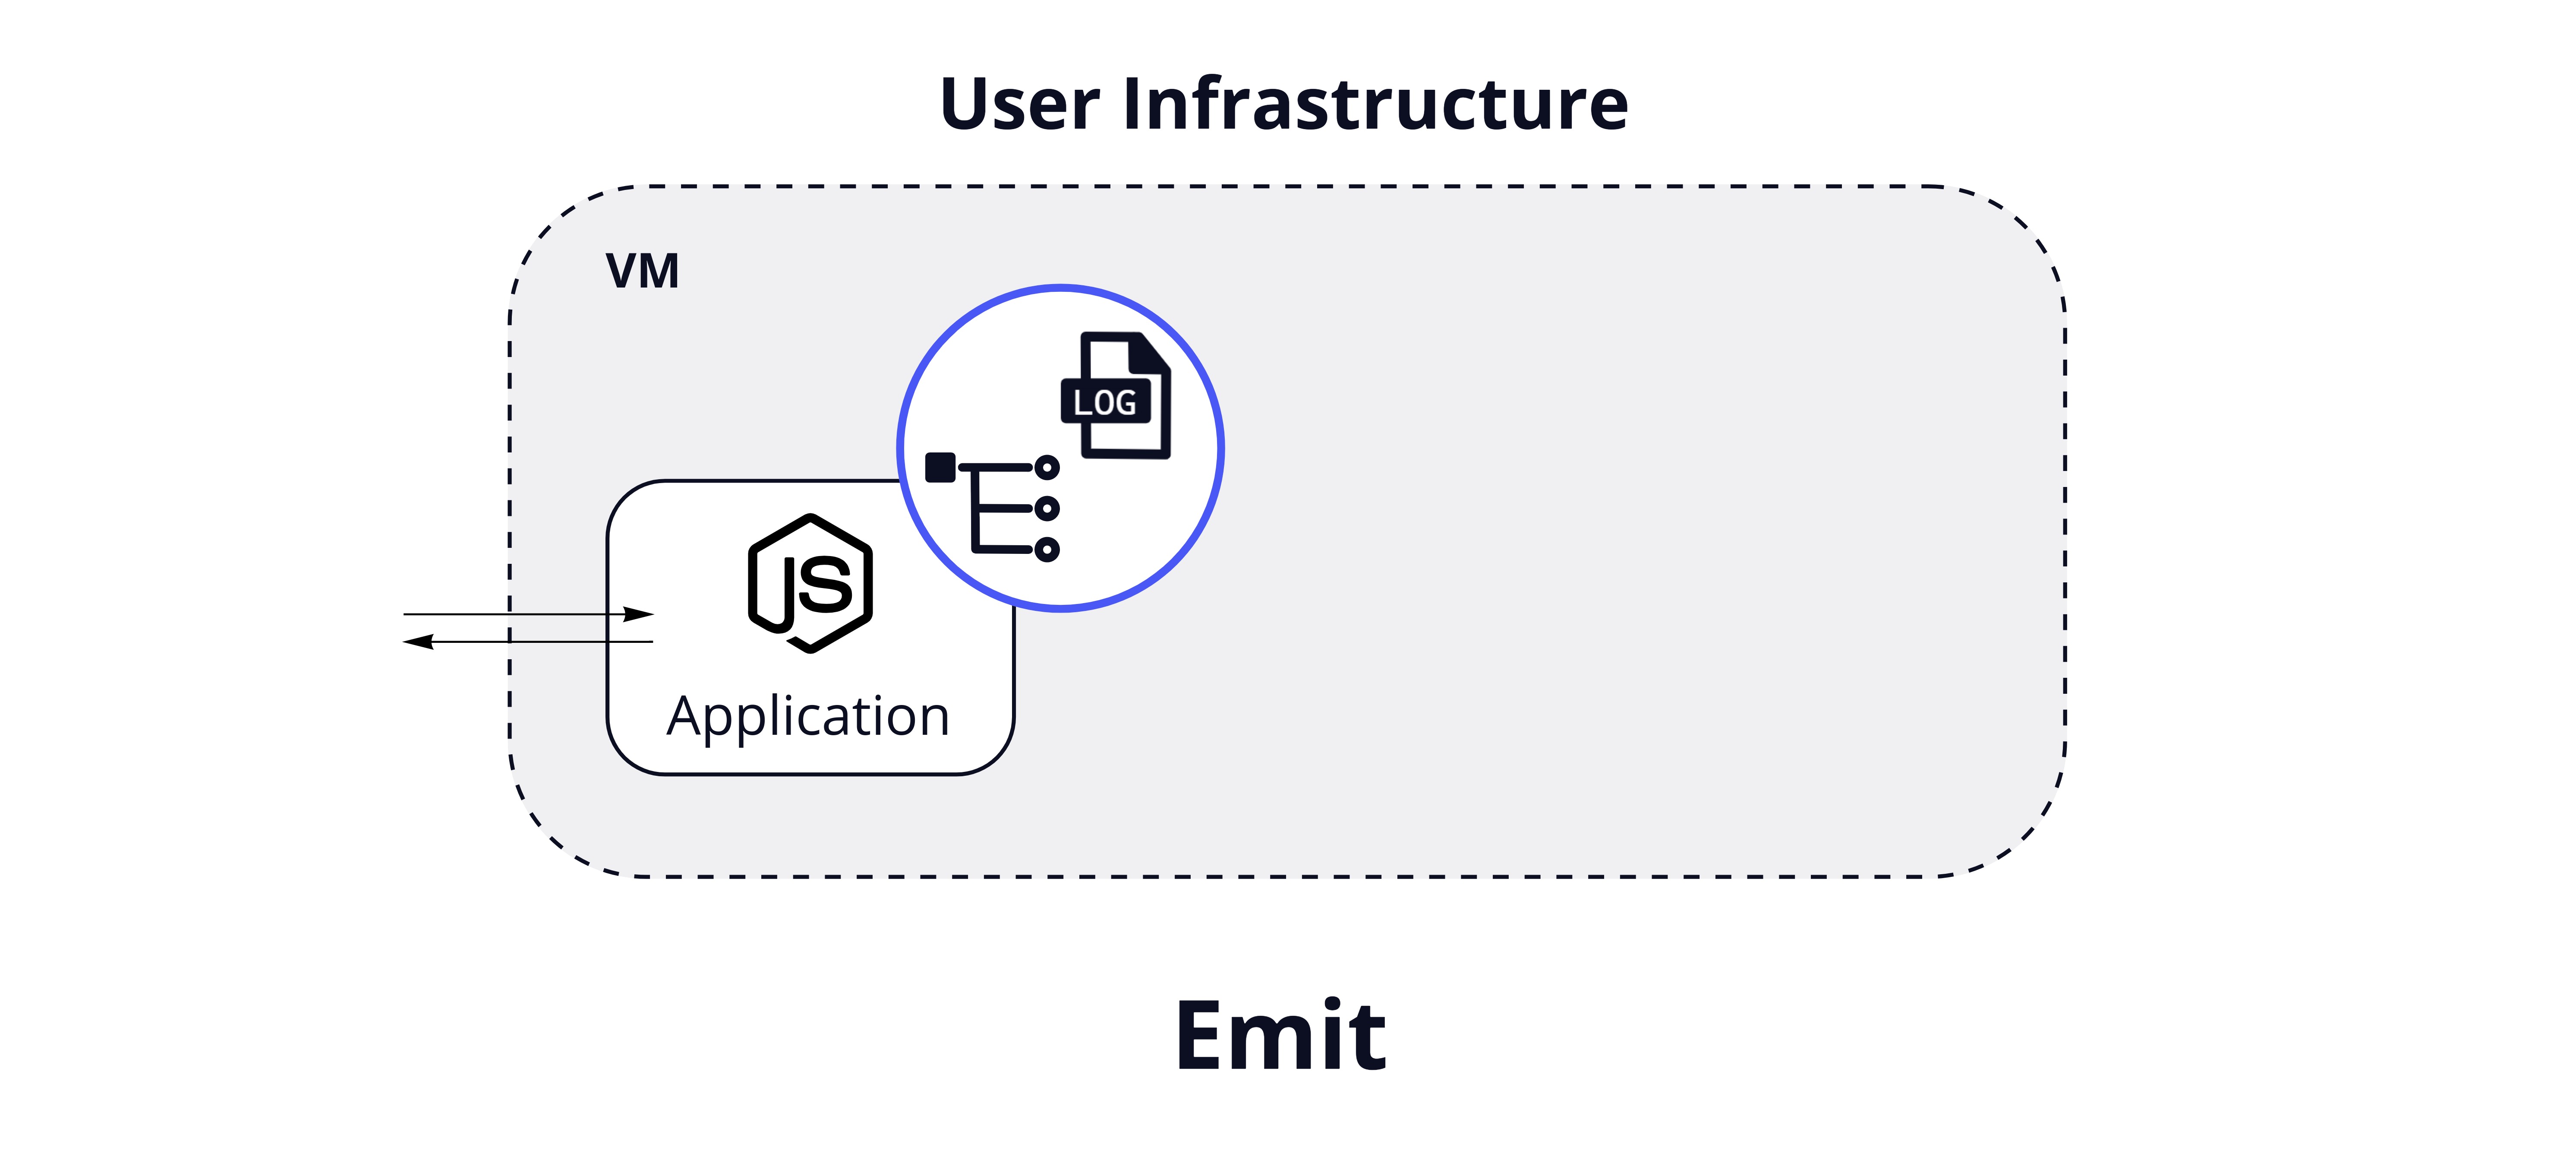
7.1 Emit
In the emit phase, Hypha needs to:
- Generate traces
- Create the correlation between logs and traces
- Collect logs and traces
- Send this data to the next phase of the pipeline
Because we wanted developers to be able to easily add Hypha to an existing application, we needed to accomplish these tasks while requiring minimal changes to existing code.
Emit: Generating Traces
One option for generating tracing data is to manually instrument the application code using a tracing library. The developer must configure the library for their application, specifying the details and attributes to attach to spans and configuring where they should be sent. This approach allows the developer to have complete control over the data included in each span. However, this takes time to learn and implement correctly. In addition, the process must be completed for each service.
For ease of use, we opted to use an OpenTelemetry auto-instrumentation package. This package wraps JavaScript libraries and frameworks to generate traces without changing the application code.
For instance, one of the libraries that is instrumented by this package is Node's HTTP library. When an HTTP request hits the service, the OTel auto-instrumentation automatically captures the request data and uses it to generate a new span for the current trace, all without the developer needing to manually instrument their code. Here is an example of the type of HTTP span data we get from auto-instrumentation, as visualized in the Hypha UI:
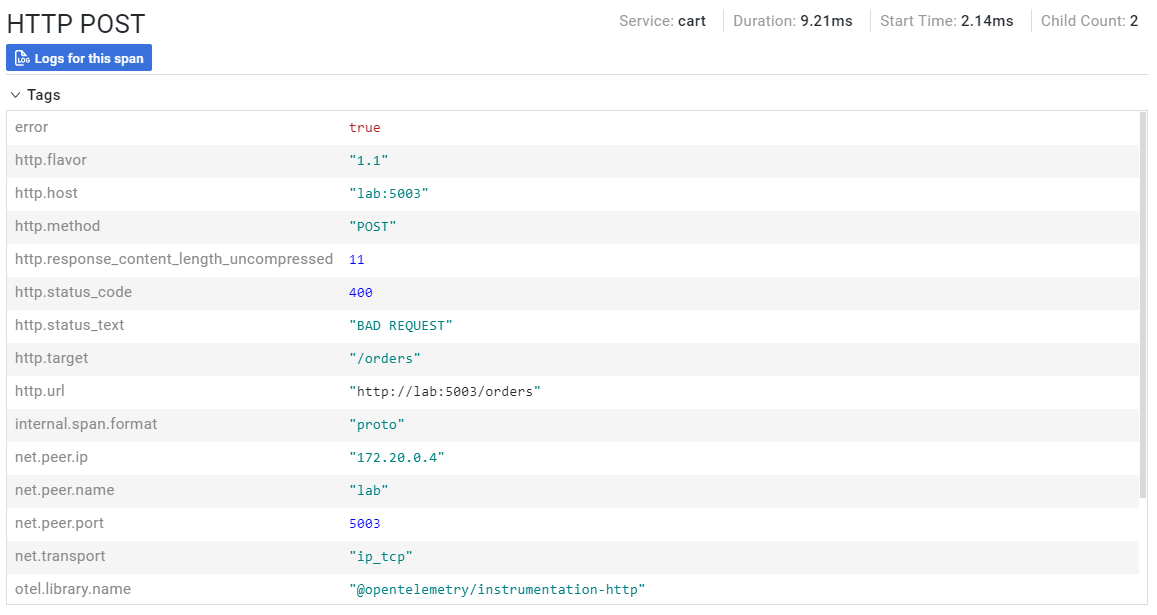
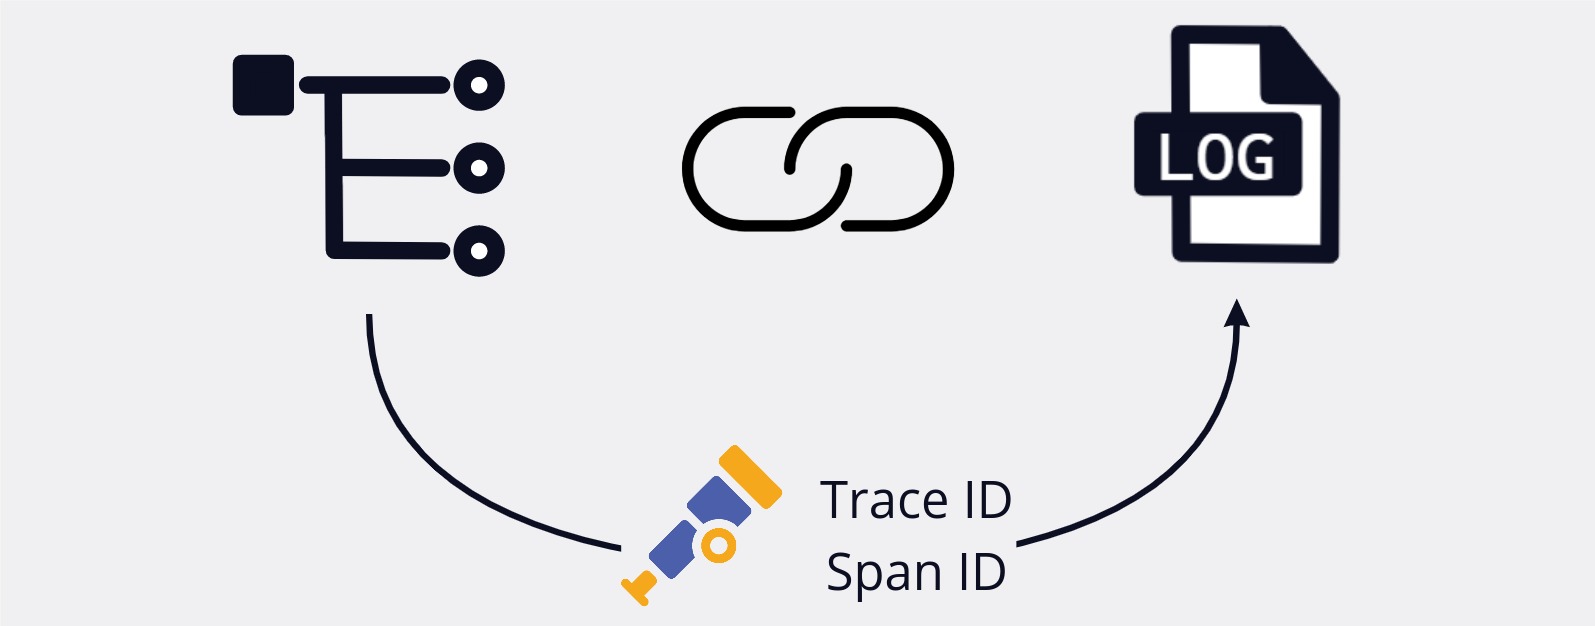
Emit: Adding Correlation Data
In addition to providing us with trace generation, the auto-instrumentation library also wraps several popular logging libraries and injects the current trace and span IDs into each log. Hypha later uses this injected context to correlate between logs and traces. We'll discuss how this works in more detail later on when we dive into Hypha's implementation challenges.
Emit: Collecting Logs and Traces
At this stage of the architecture, Hypha has instrumented traces and logs, and this telemetry data is correlated through trace context.
Now Hypha needs to send this telemetry data to the next pipeline phase.
For traces, we could configure the auto-instrumentation to send trace data directly to the next stage in the pipeline, but there are advantages to offloading this responsibility from the main application. For instance, this would enable us to perform processing on the traces and to batch the data, making for more efficient network usage. For this reason, we configure the instrumentation code to send traces to an OpenTelemetry Agent Collector. The Agent Collector runs as a separate binary on the same host as the instrumented application.
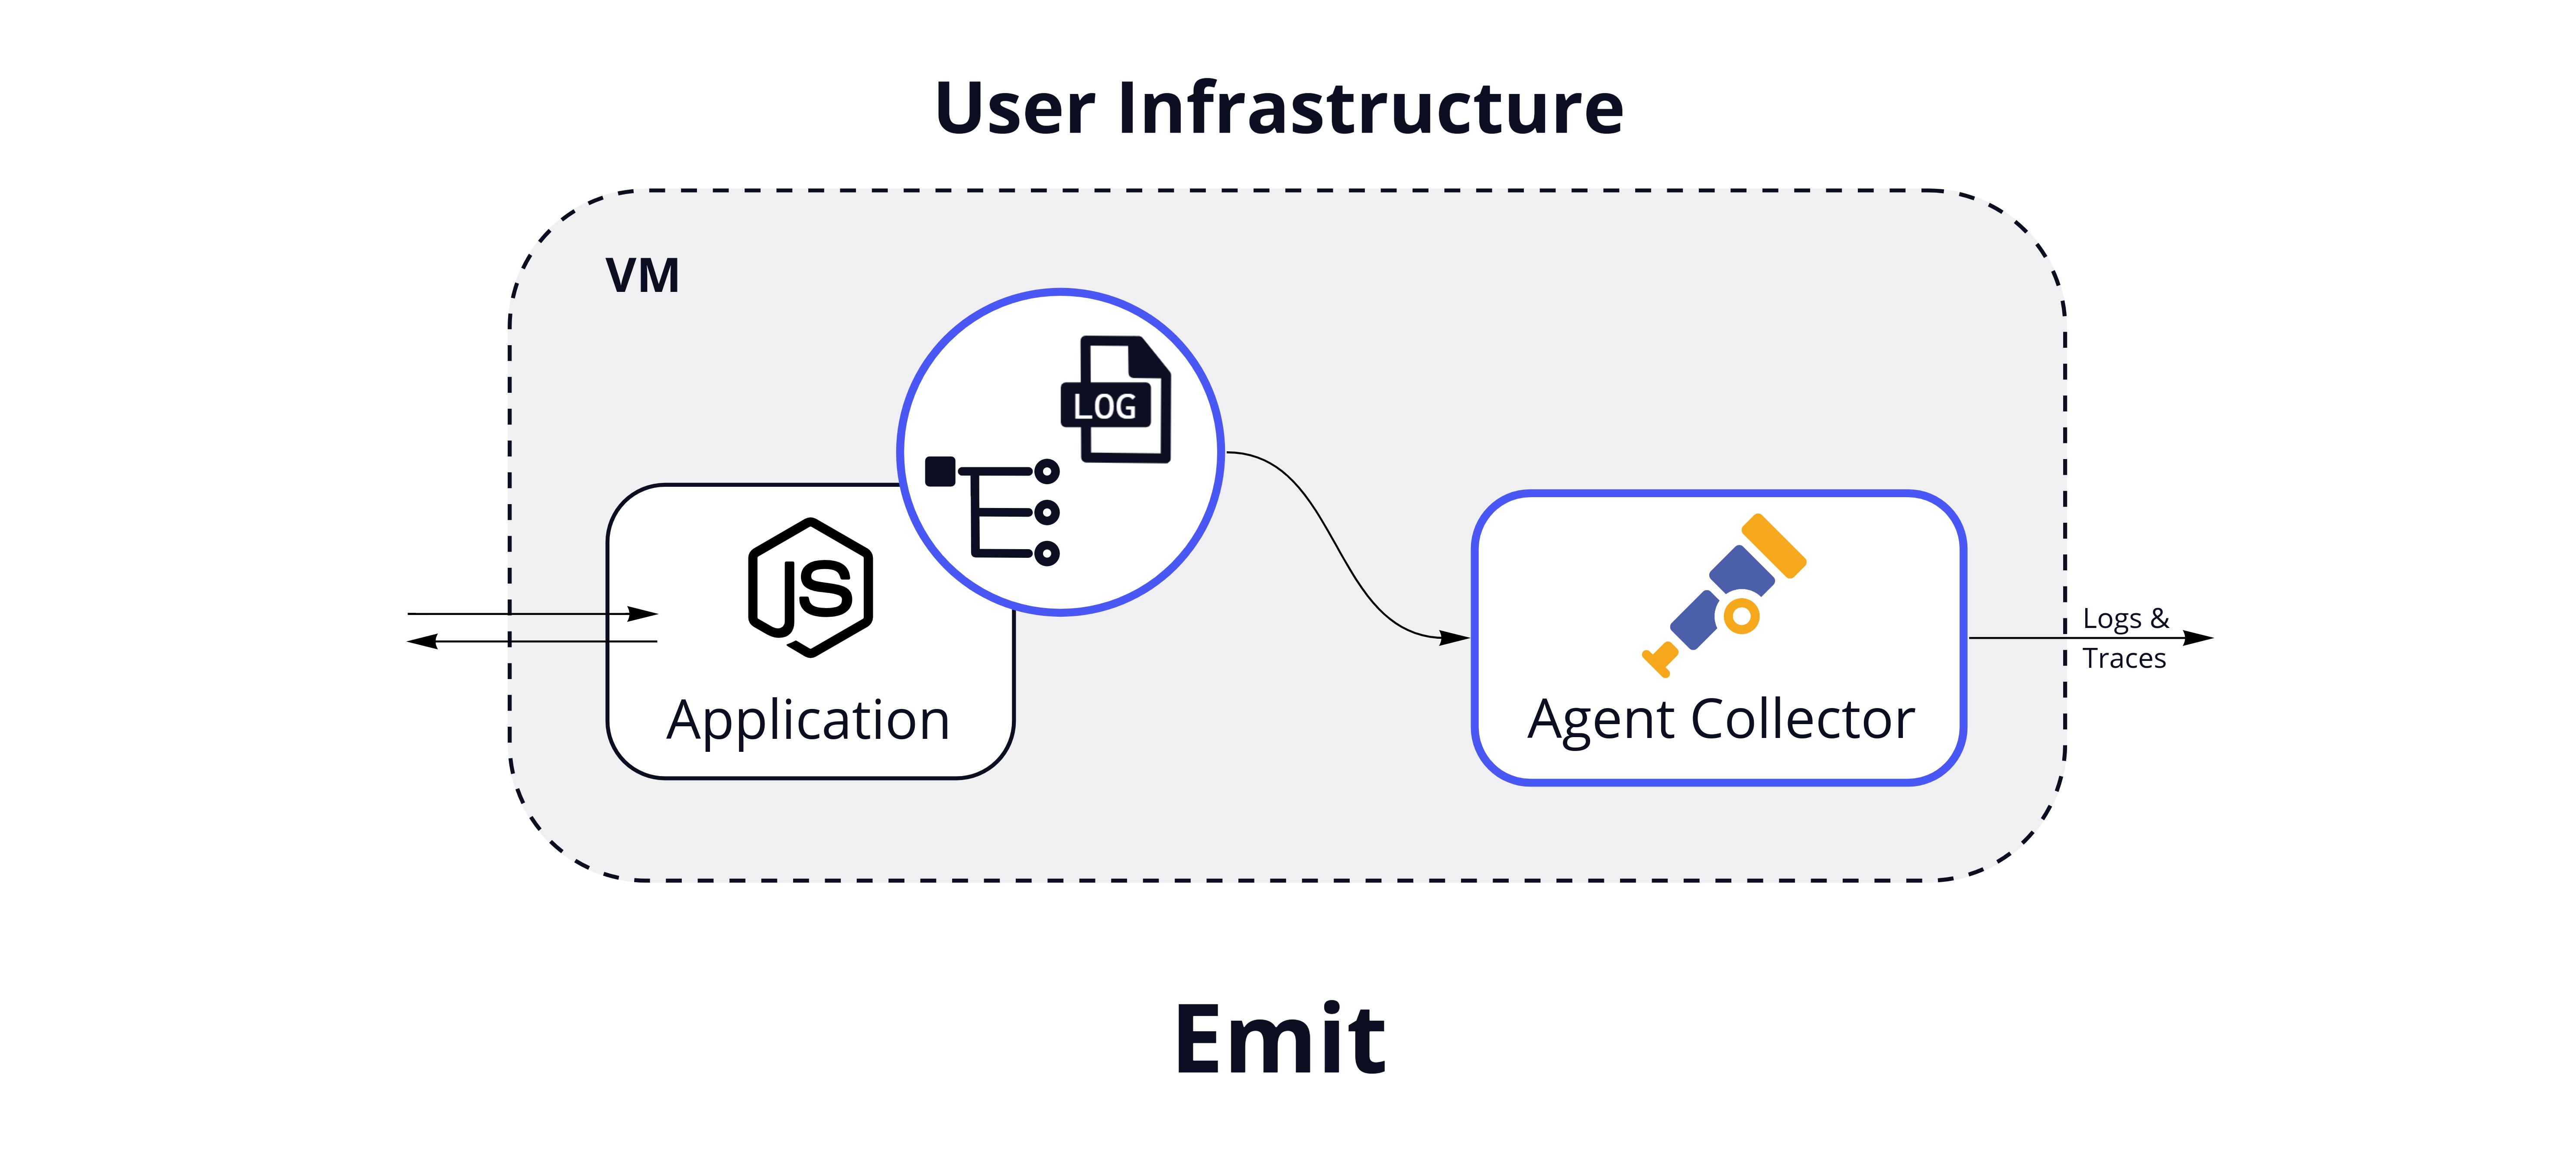
For logs, there are several approaches Hypha could take for collection and processing. The most direct way would be to have developers change their application code to send logs straight to the Agent Collector. However, we wanted Hypha to require minimal changes to existing application code. We chose to use the OpenTelemetry filelog receiver with the Agent Collector, which scrapes logs from existing files. While this option is not as fully-featured as some other solutions such as FluentBit, we wanted to reduce the dependencies needed at this stage, so we use one Agent Collector to handle both logs and traces.
Emit: Sending Data
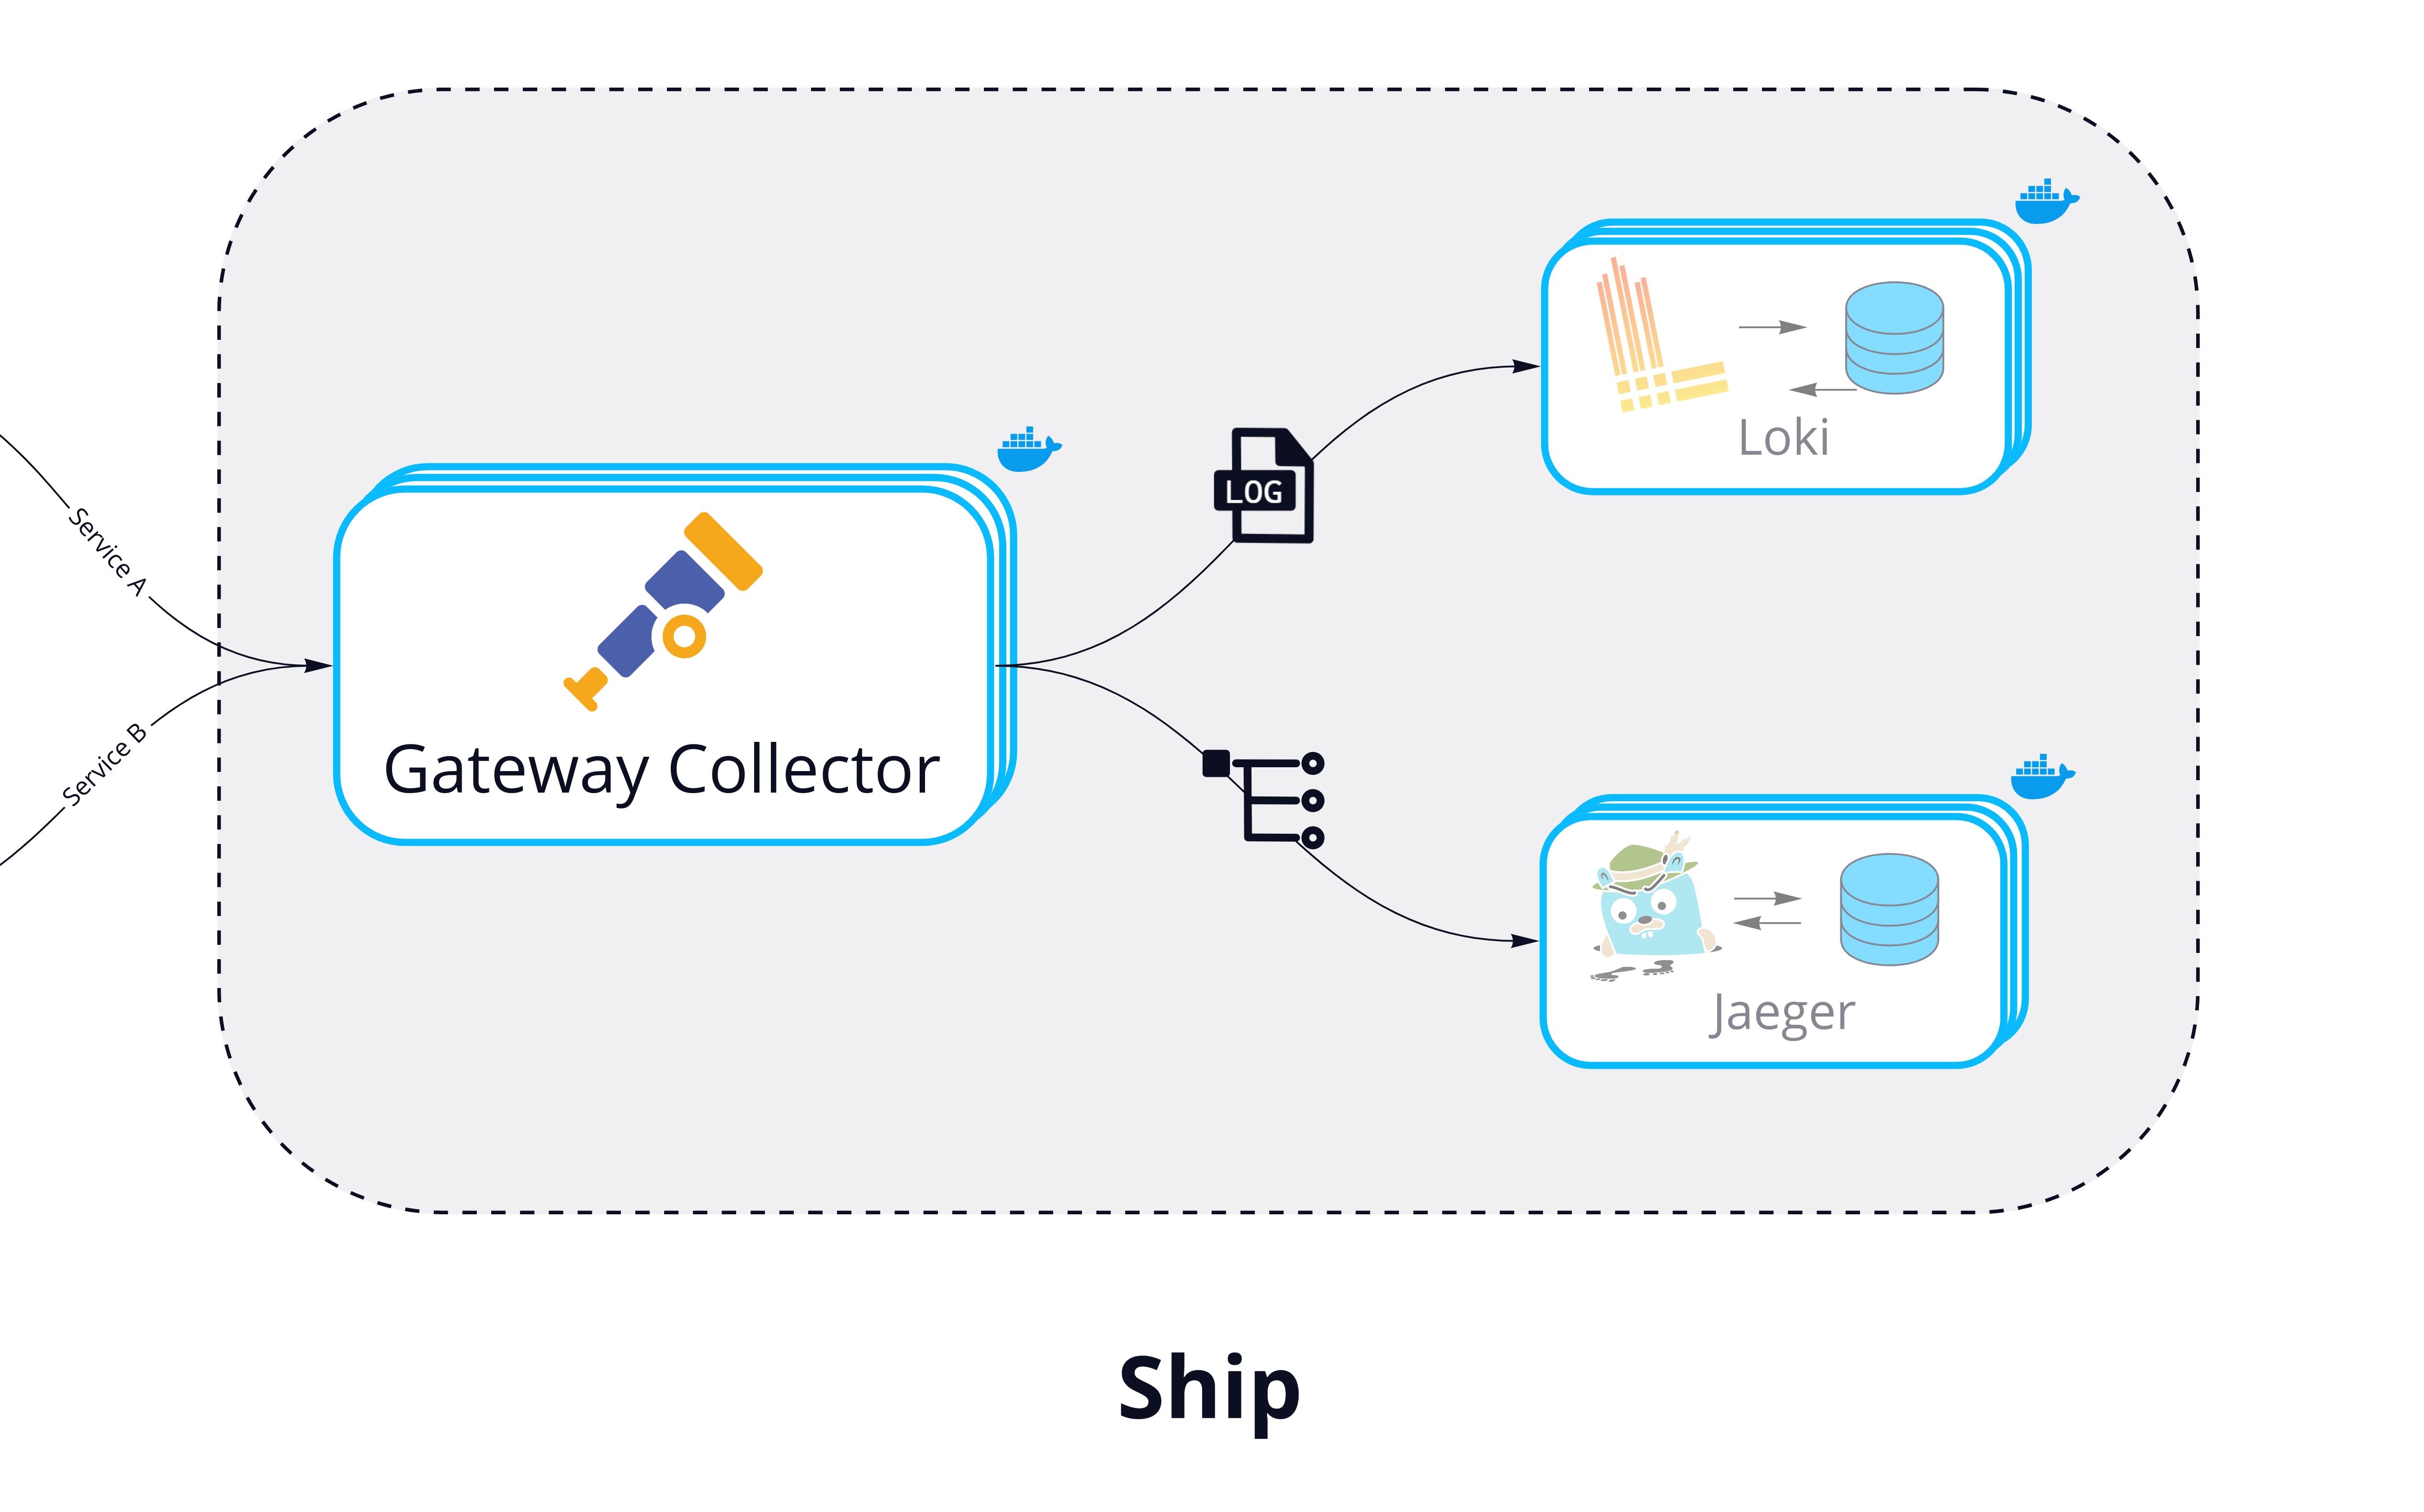
With instrumentation for logs and traces in place, the Agent Collector can be configured to emit the telemetry data to Hypha's backend. Since this process is needed across multiple services, Hypha provides a script to automate downloading and configuring the Tracing Libraries and Agent Collector for each service.
7.2 Ship
In the ship phase, Hypha needs:
- A central location for telemetry aggregation and processing
- Storage solutions for logs and traces that can handle high throughput.
We also wanted these tools to be flexible and scalable to handle future changes.
Ship: Aggregate and Process Telemetry
Hypha uses the OpenTelemetry Collector deployed as a central Gateway to handle aggregation, processing, and exporting.
This approach provides many benefits. OpenTelemetry is quickly becoming the gold standard for telemetry data, and it already integrates well with most observability tools. This helps give developers the flexibility to easily change tools if needed. For example, if a developer wants to export their trace data to a different tool, they can simply change a few lines of code in their Gateway configuration. Having a central gateway also makes it easier to configure data enrichment and processing from one place.
Ship: Storing Logs and Traces
Production applications can produce a massive amount of telemetry data, so Hypha's storage solutions should be able to handle high throughput. They need to write data quickly and should be able to scale. Hypha uses different solutions for logs and traces to separate concerns and provide flexibility.
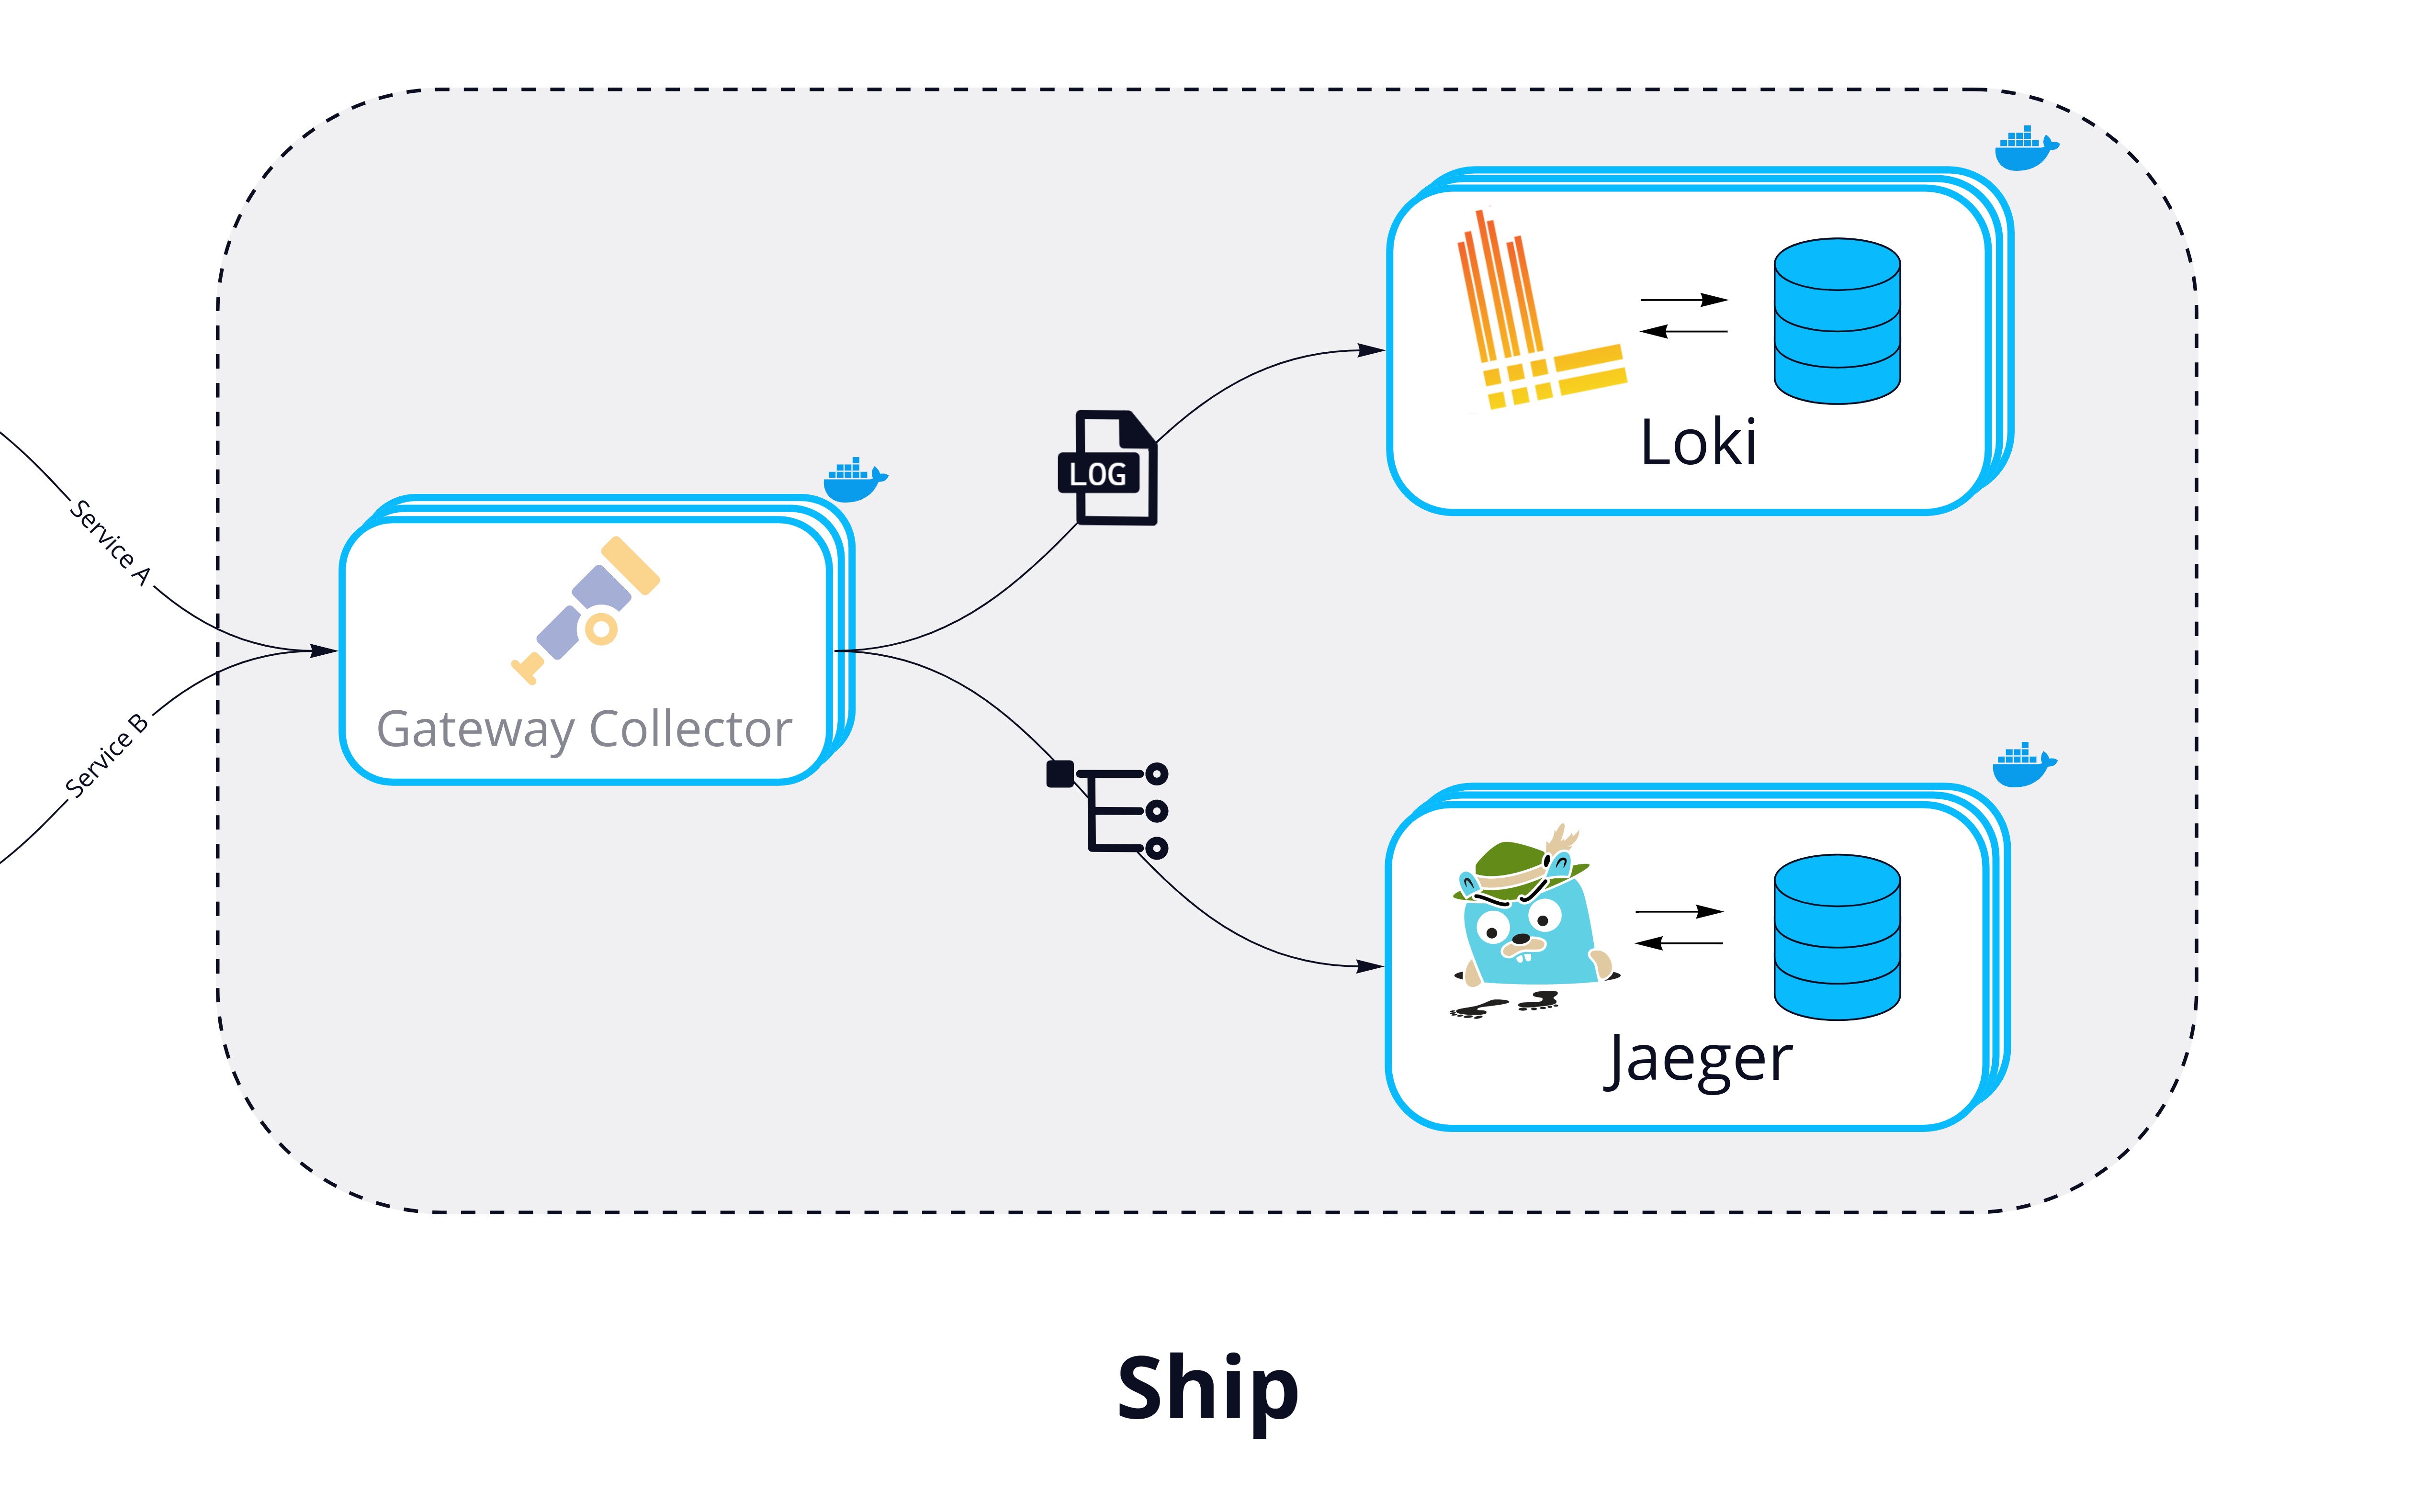
For logs, Hypha uses Grafana Loki. Loki is designed to index logs by key-value pairs called labels. Indexing this way makes Loki cheaper to operate than a full index and enables it to handle high log volumes efficiently. Additionally, we needed a solution that would work well with Grafana, which we chose to power Hypha's UI. Because Loki is part of Grafana labs, it integrates well with Grafana and is well-suited to the way that Grafana handles telemetry linking.
For traces, Hypha uses Jaeger, an open source tracing tool with extensive community support. Initially, we explored Grafana Tempo as an option, since it integrates well with other Grafana Labs tools and is designed to link telemetry data. However, we ultimately chose Jaeger because it allows more extensive search options than Tempo, and we wanted to give developers more options to search their traces individually.
Both Loki and Jaeger are configured to run as scalable and platform-agnostic containerized services.
7.3 Present
In the Present phase, Hypha needs to:
- Query telemetry data from Loki and Jaeger
- Visualize that data within a central UI
The UI should leverage Hypha's correlated telemetry data to allow users to flow between related logs and traces. Hypha needs to accomplish this while also being easy to use: the UI shouldn't require a steep learning curve.
One possibility was to create our custom UI to handle querying and visualization. While this would have allowed a very focused experience, it would have meant significant effort and would not have been as feature-rich as incorporating existing solutions.
Another option was to use Grafana, a powerful open-source tool capable of querying and visualizing data from many different sources. However, a downside to using Grafana is that its extensive feature set can be difficult to learn, configure, and start using.
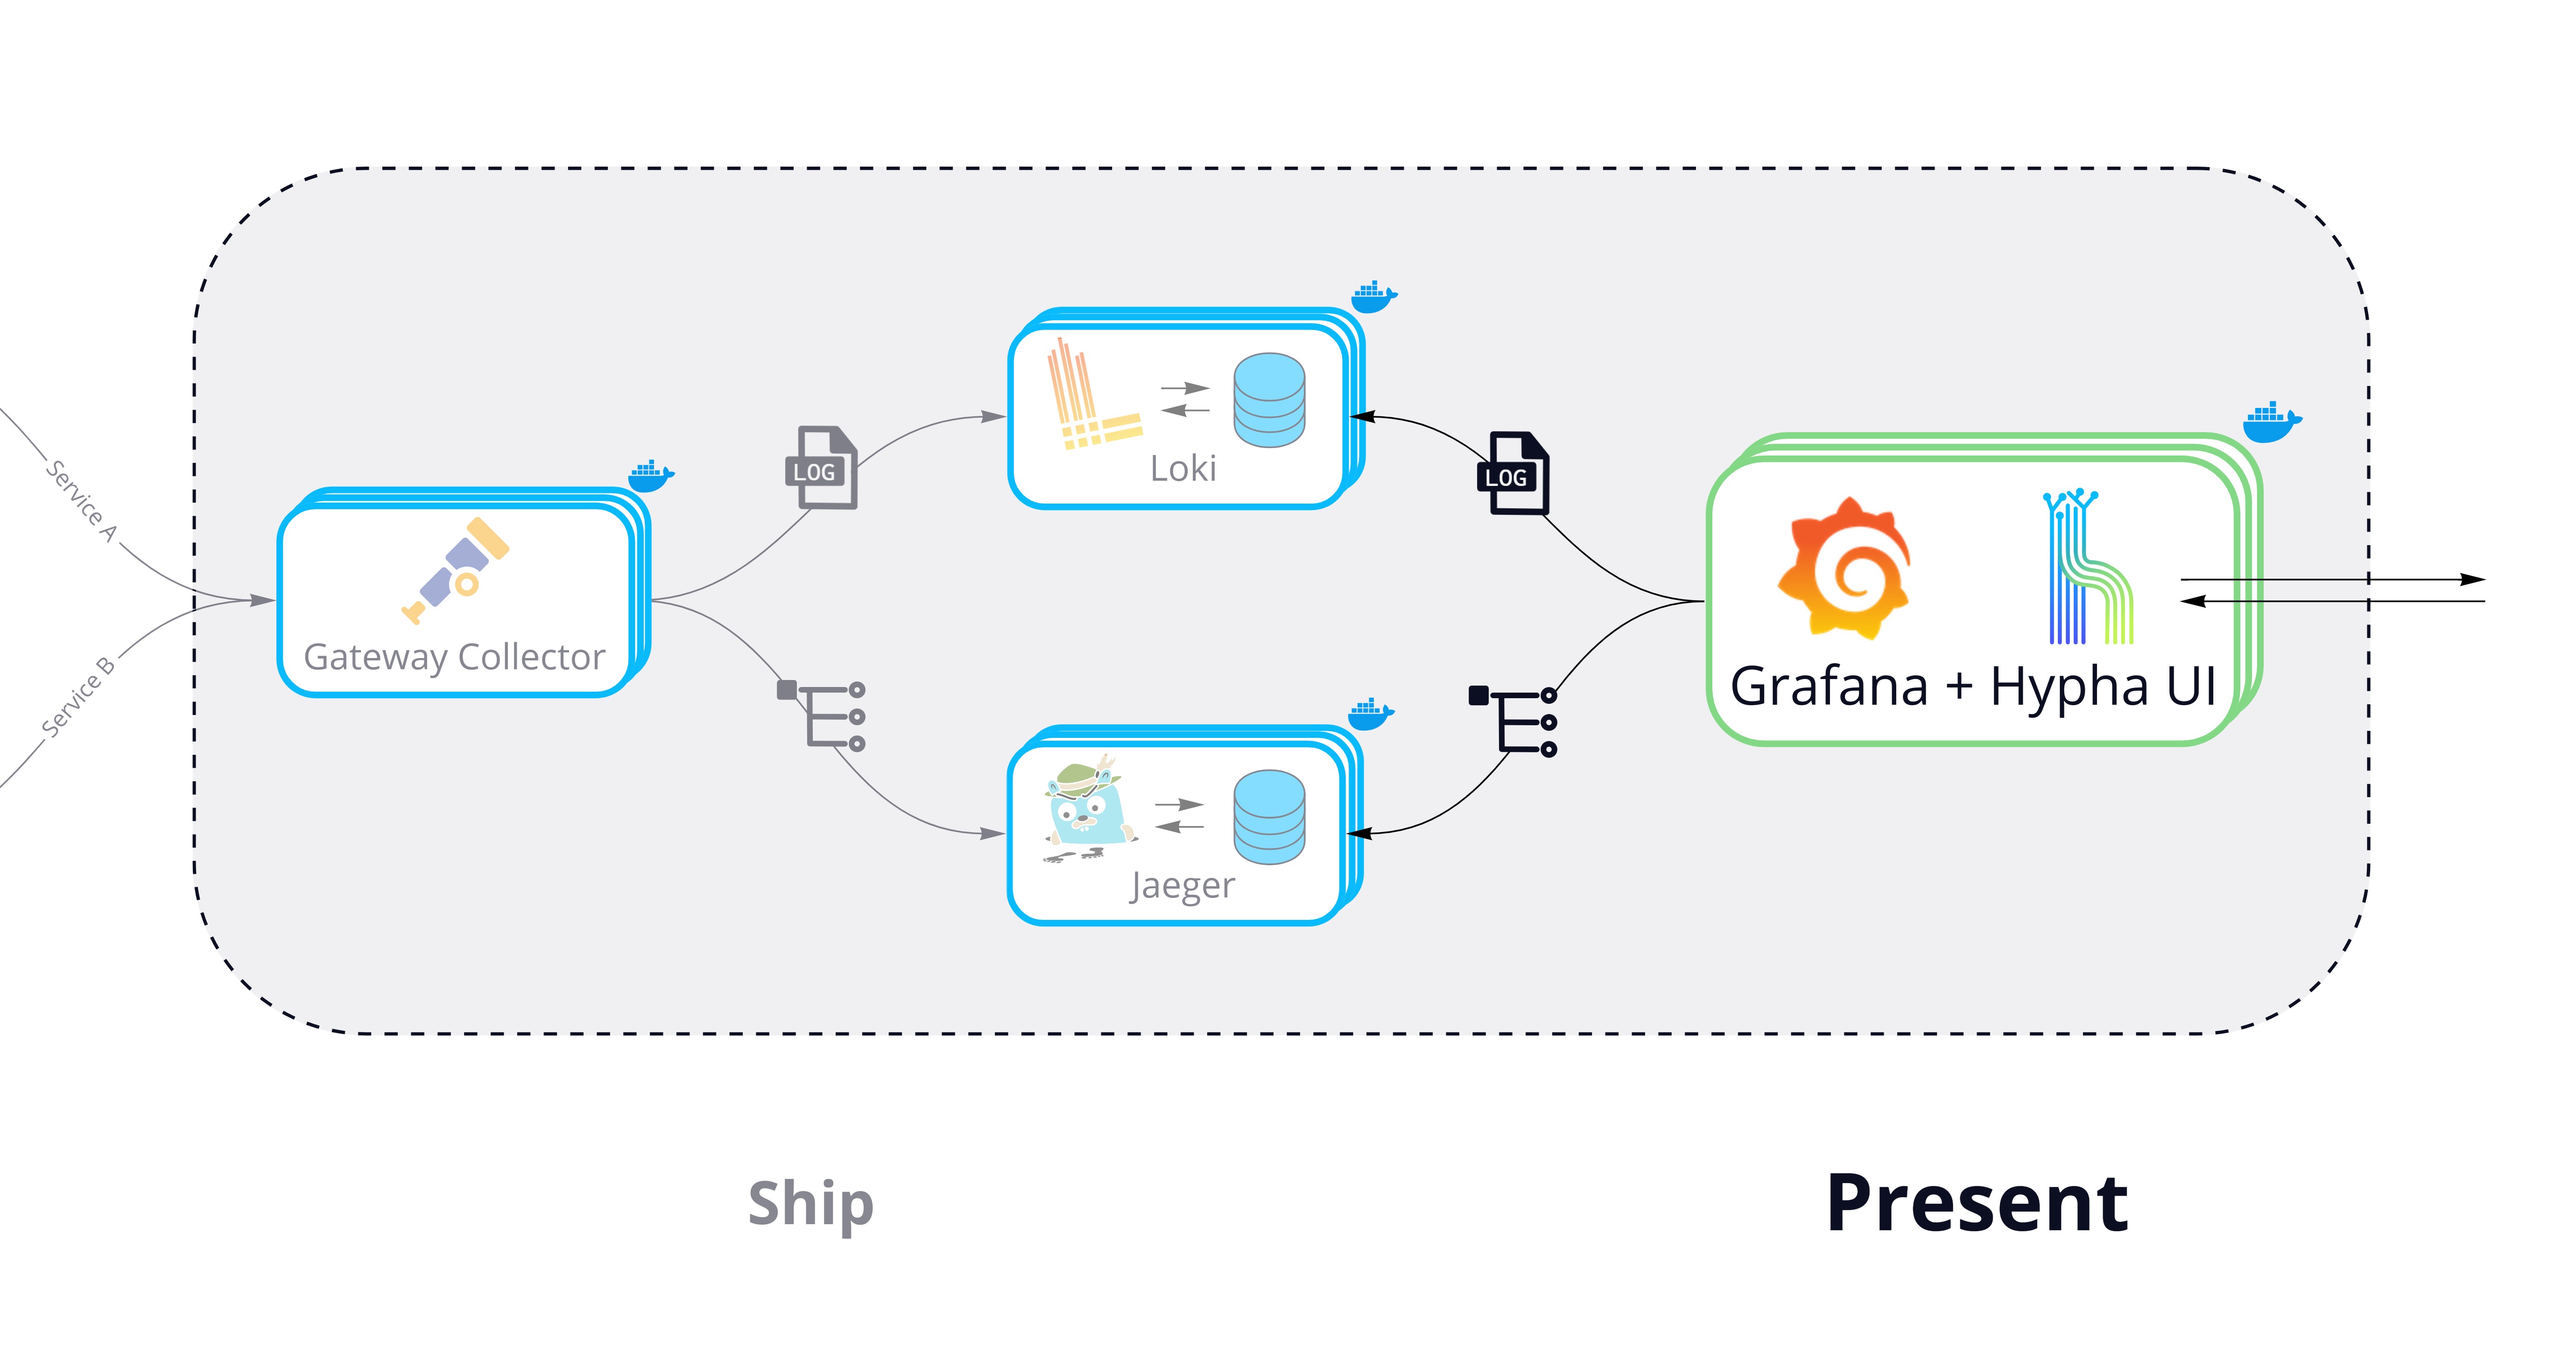
We developed the Hypha UI to address this challenge. It wraps Grafana in an intuitive, focused interface and provides customized dashboards. Developers can get started quickly without a steep learning curve while maintaining access to Grafana's powerful features.
Hypha leverages Grafana to proxy API calls to both Loki and Jaeger data sources. Grafana also provides feature-rich interfaces for querying both traces and logs. Lastly, and most importantly, Hypha configures Grafana to link related logs and traces within debugging flows.
The Hypha UI completes the final stage of our end-to-end telemetry pipeline.
8. Implementation Challenges
8.1 Correlating Logs With Traces
Types of Correlation
One of the primary engineering decisions we needed to make was choosing the best way to correlate logs with traces. There are several different types of correlation we considered, each with its own tradeoffs. [7]
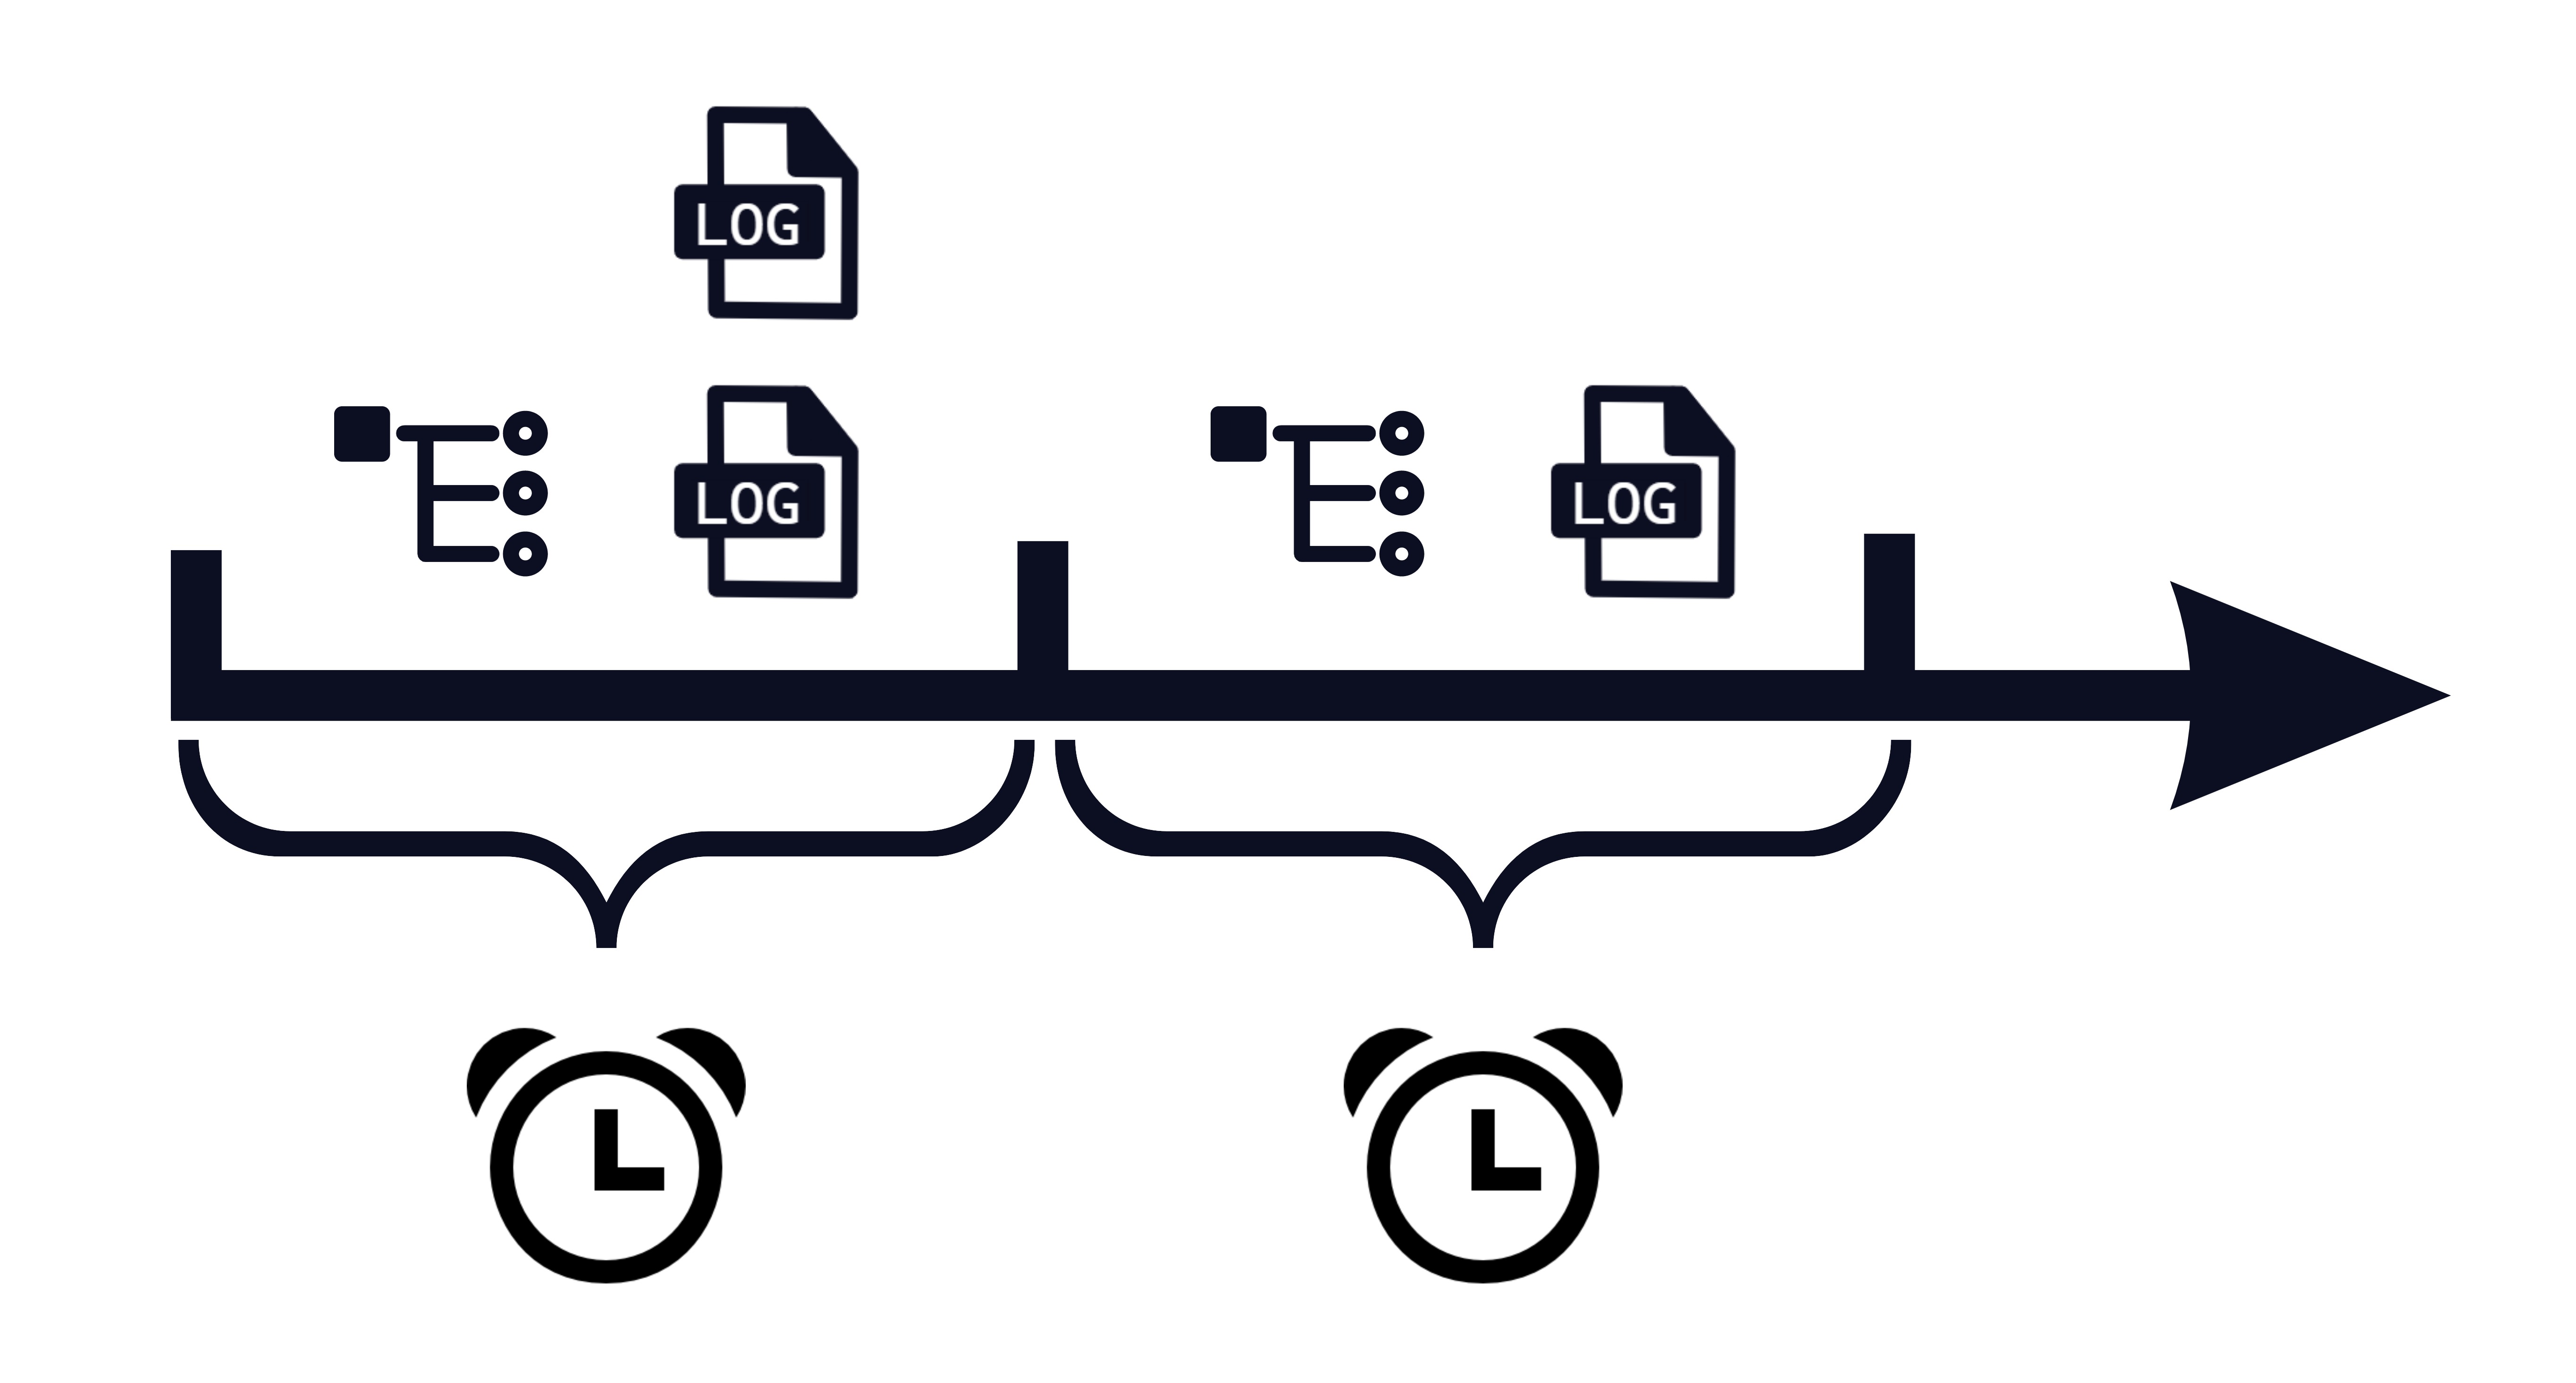
Time
Because both logs and traces contain time-based data, this seems like a natural way to correlate the two. The upside of this approach is that it does not require adding any additional information into either type of telemetry. Unfortunately, the correlation this produces is not specific enough to be useful. Since many requests can occur concurrently, a single log could be linked with several traces and vice-versa.
Origin
Another approach is to correlate by the origin of telemetry. The common point of reference is the resource which emitted the logs and traces (e.g. the name of the service or host). This approach shares the advantage of being relatively straightforward, as this data is usually included with or added to logs and traces. However, correlation by origin also lacks the specificity needed to be useful, since a single resource will produce many logs and traces.
Execution Context
We wanted to link logs and traces more tightly than was possible by time or origin. To be truly useful, logs needed to be correlated with exactly one span and trace, and each trace needed to correlate with only the logs that were produced as part of that trace's request. We considered two primary approaches to this kind of tight correlation.
Correlating By Execution Context
Span Events
One option for correlating by the execution context involves replacing logs with span events. Span events are a form of structured logs appended directly to spans. Like logs, they're good for recording fine-grained details about events at a point in time. So, instead of being separate types of telemetry, logs are appended to spans as events and directly inherit the trace context.
This option simplifies the telemetry pipeline architecture: we would only need to collect, store, and query traces. However, this would require users to refactor their code to attach events to spans instead of outputting logs. Rather than continuing to output logs using a library, developers would need to write new code to create span events, which might look something like this:
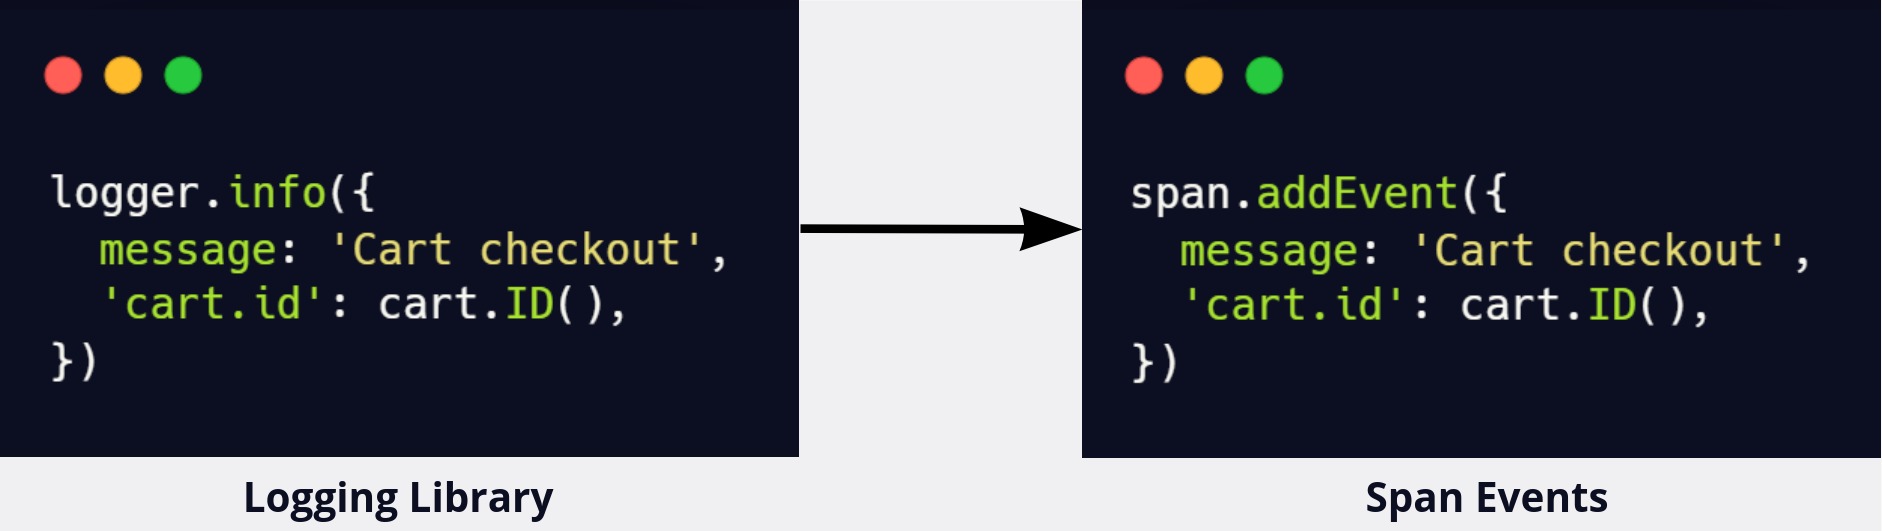
For engineers used to working with logs, this would be a fundamental change in their debugging flow, because the data they're used to accessing from logs would now be accessed from spans. Spans are a distinct data type that require learning a new set of tools to use, which would be a significant learning curve. Additionally, developers would need to make code changes everywhere they currently use logging, which would be a time-consuming and tedious process.
Inject Context into Logs
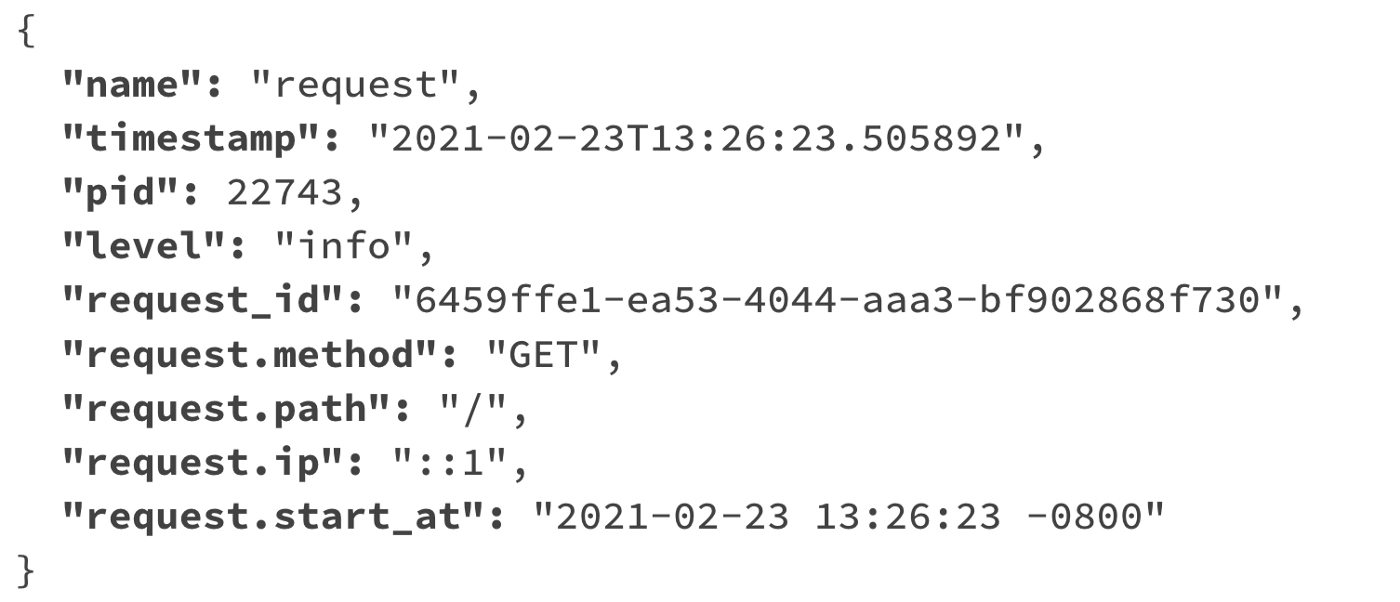
Another option to achieve correlation by execution context is to inject trace context into existing logs. This means accessing the trace ID and span ID and appending it as metadata to each log. For example, a JSON log that starts like this:
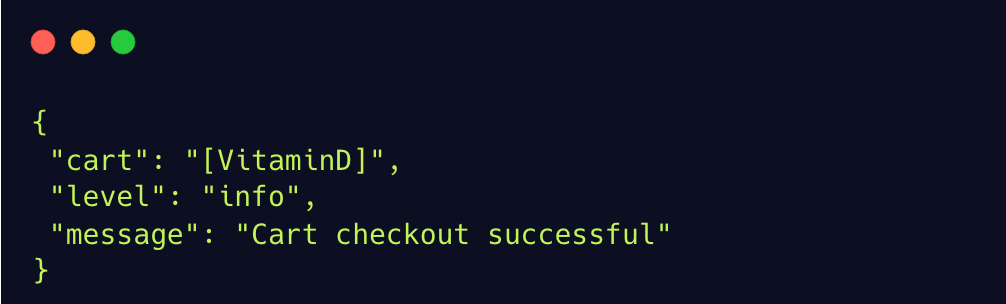
Would look something like this after trace context is injected:
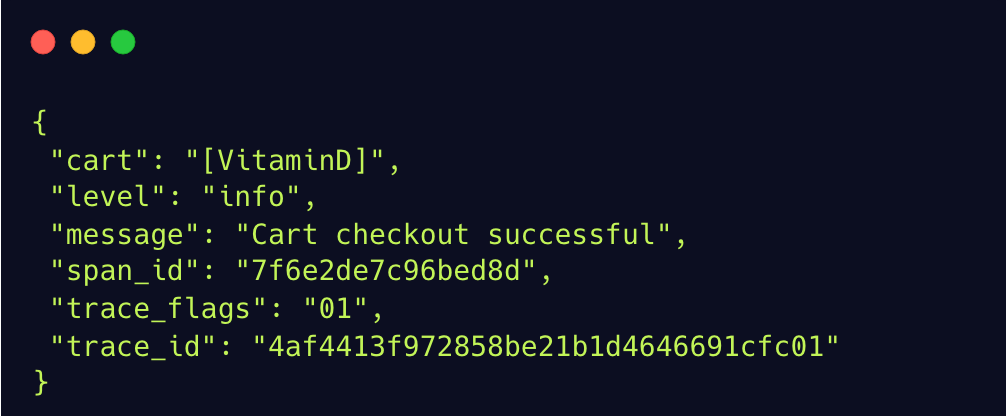
This approach has the downside of making the telemetry pipeline more complex, since traces and logs need to be processed, stored, and queried separately. But the upside of this approach is that it keeps existing logs intact, only adding the execution context. Also, this correlation can be achieved without fundamentally changing the workflow of engineers who are used to logs. Since we wanted to minimize changes to existing code, we decided to inject trace context into logs instead of using span events.
One option to implement trace context injection was to create a custom library that extends popular logging libraries and injects the trace context. However, we were able to take advantage of the Open Telemetry auto-instrumentation package, which is configured to instrument many popular logging libraries by injecting trace context directly into the logs produced by those libraries.
In the presentation phase of the pipeline, the ability to correlate logs and traces visually was also a major consideration. Although the data needed for correlation was added in the emit stage, we now needed to leverage that data so that users could move between logs and traces in the UI. This was a major factor in choosing Grafana, which supports the functionality needed to transform correlated telemetry data to visual interaction.
8.2 Deployment
One of our primary design goals was for Hypha to be easy to deploy. To meet this goal, Hypha needed to be platform agnostic, scalable and automated as much as possible.
Platform Agnostic
Early on, we chose to containerize Hypha's backend components using Docker and Docker Compose. This makes Hypha easy to manage and deploy across many environments. Furthermore, Docker integrates well with several popular cloud platforms, simplifying deployment to managed cloud container services.
To start, we made sure developers could easily deploy Hypha's backend locally, using simple Docker Compose commands to run and connect Hypha's components. From there, we wanted to give developers an easy way to deploy our backend to a cloud environment. But first, we needed to ensure that Hypha's services were scalable to handle production-level data.
Scalable
Both Loki and Jaeger can run as "all-in-one" configurations, where a single binary handles read, write, storage and visualization responsibilities. This is fine for local development, but we wanted a solution that would allow these services to scale at a production level.
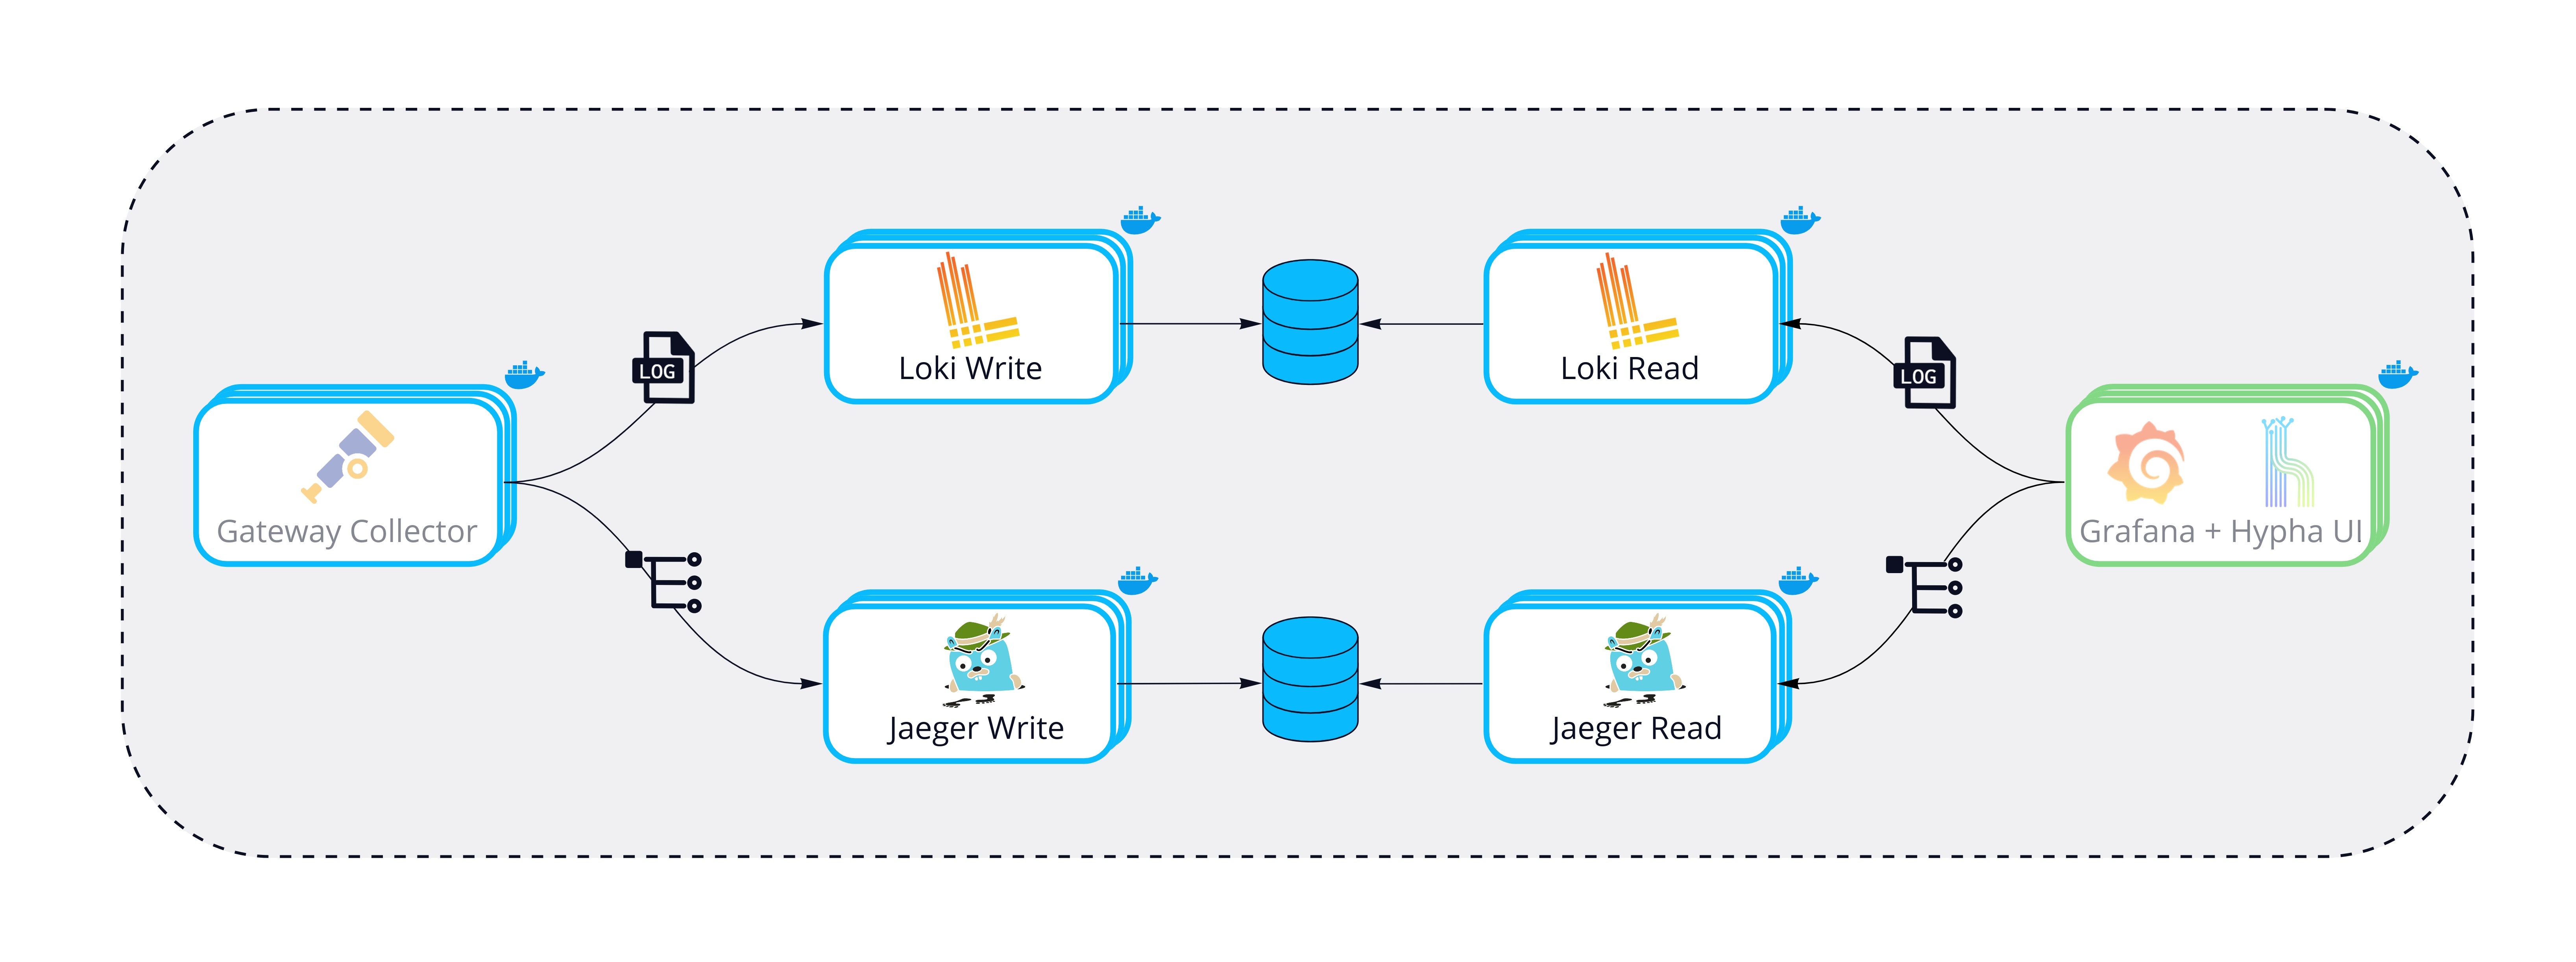
We opted to separate read, write, and storage concerns into three services running as individual containers. Compared to the "all-in-one" deployment configuration, this allows for higher availability and the flexibility to independently scale nodes as needed. For example, the Loki configuration can now scale to ingest several TBs of logs per day, whereas previously, it was limited to approximately 100GB per day. [8]
With Hypha's components ready to scale, we began exploring options for cloud deployment. We chose AWS Elastic Container Service, a popular platform that integrates well with Docker Compose. It manages many aspects of containerized applications, such as network communication and resource scaling.
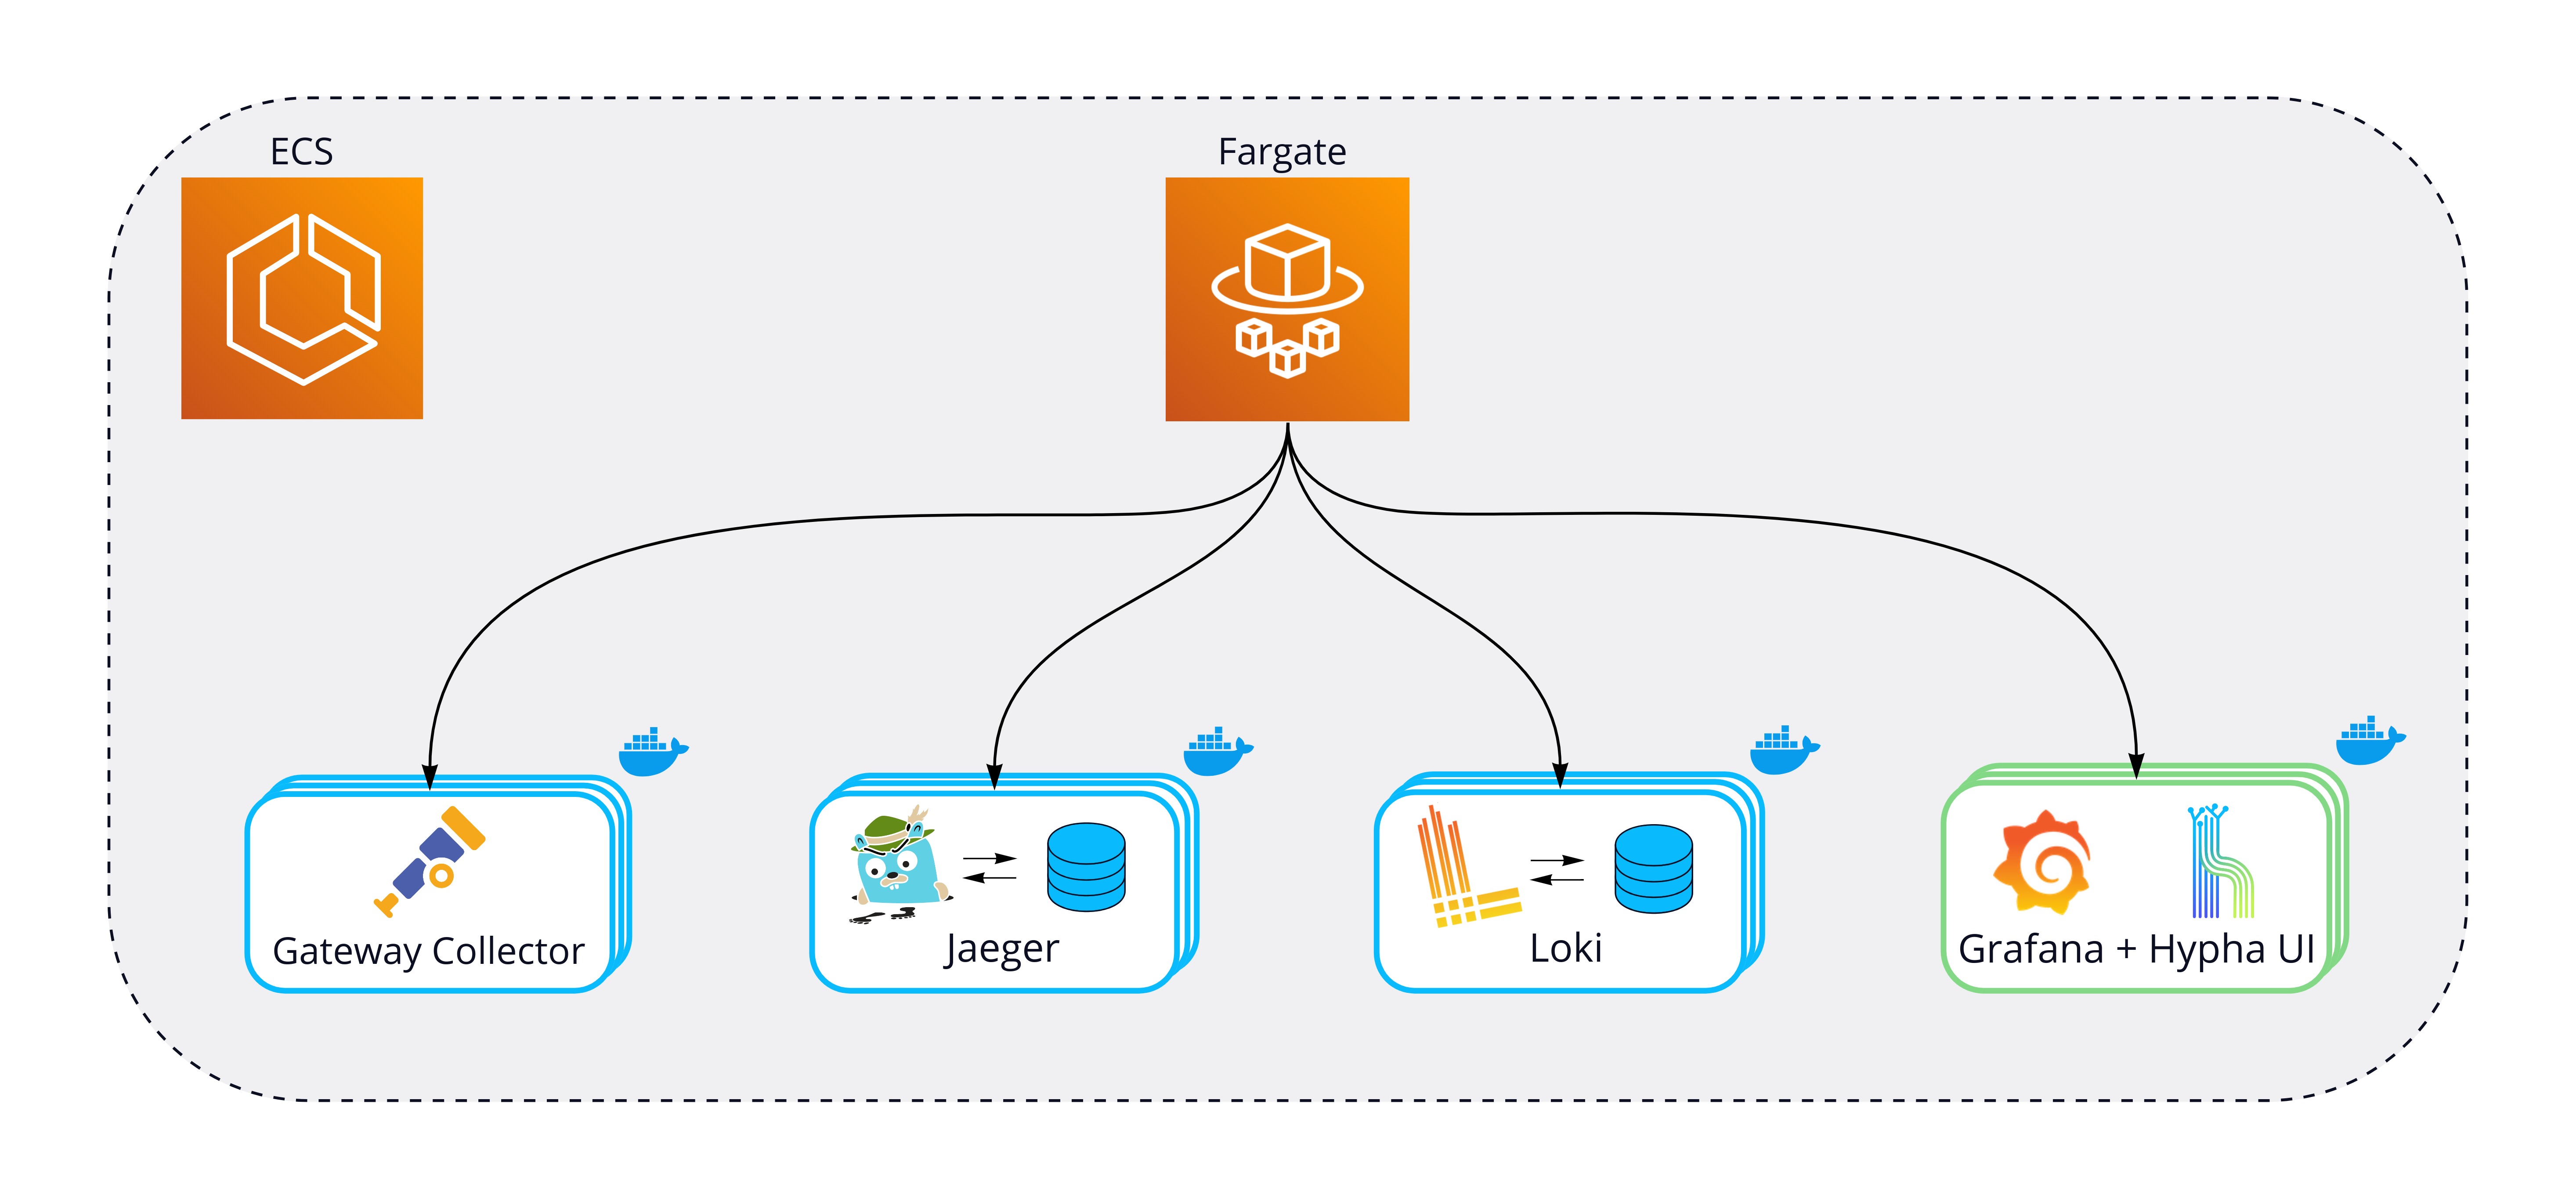
ECS can be configured to run on user-managed AWS EC2 instances or via AWS Fargate, a managed serverless solution for running containers in the cloud. While deploying to EC2 has some potential advantages around price optimization, it also requires manual management of these EC2 instances. Hypha users would need to ensure the ECS cluster has enough compute resources as well as stay on top of security updates. We chose to use Fargate because it runs and manages infrastructure and automatically scales according to the resources required.
9. Using Hypha
There are two stages to setting up Hypha:
- Deploy the Hypha backend infrastructure
- Setup the instrumentation and agent for each service
9.1 Deploying the Hypha Backend
We provide the options to deploy locally, to a VPS, or to AWS ECS.
To deploy Hypha's backend locally or directly on a VPS, clone the Hypha Backend repository, and run docker compose -f local-compose.yml up.
ECS deployment requires AWS CLI to be set up with the credentials for the account you intend to deploy Hypha to. This also requires Docker Desktop (Mac/Windows) or Docker Compose CLI (Linux).
Hypha leverages Docker's ECS integration to convert a Docker Compose file to a CloudFormation template. This CloudFormation template is then used to configure and deploy Hypha's backend to ECS on Fargate. Deployment to AWS ECS can be done in three easy steps:
- Create an ECS context
- Switch to that context
- Compose up
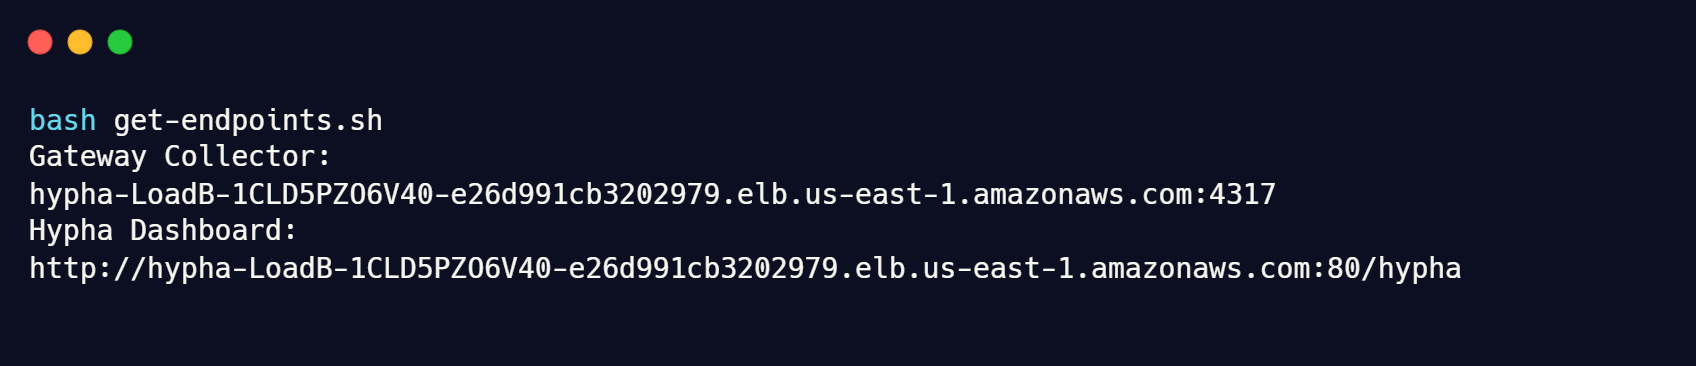
Once the deployment processes are complete, retrieve your gateway collector and Hypha UI endpoints by running:
9.2 Setup Instrumentation & Agent
Instrumentation
Once you deploy the Hypha backend, you will need to set up the instrumentation and agent for each VM/service you wish to observe.
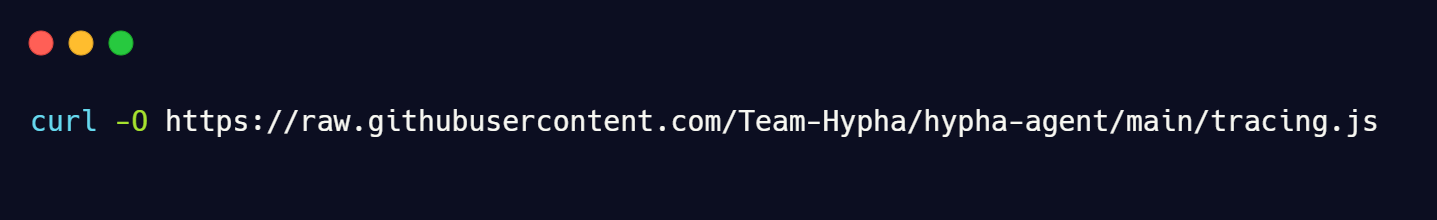
In your application directory, download the Hypha instrumentation file:
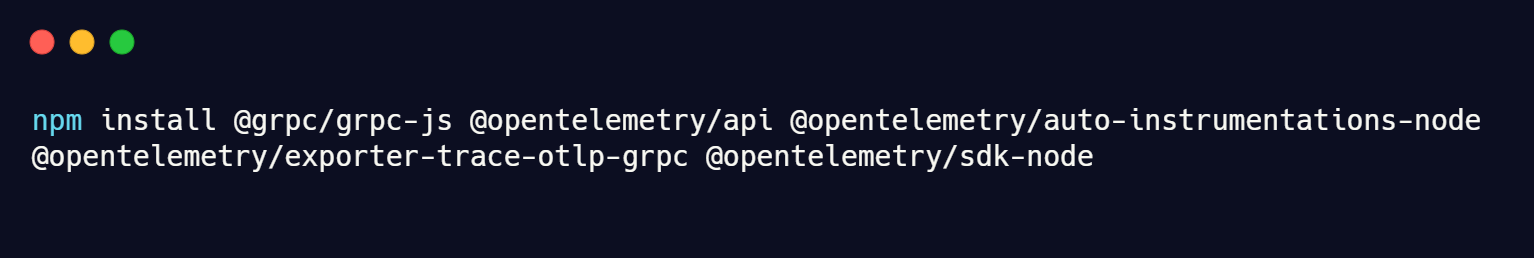
Install dependencies for OpenTelemetry instrumentation:
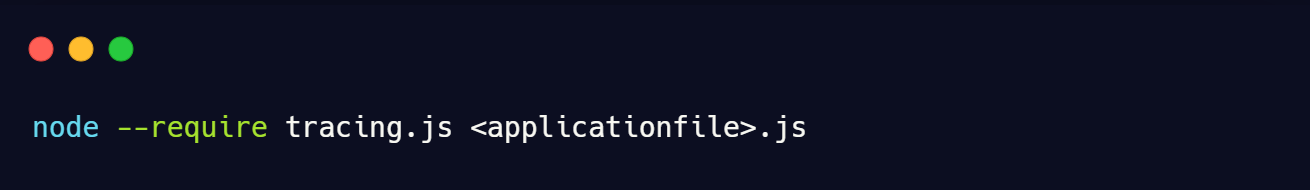
Then restart your Node application to include the instrumentation:
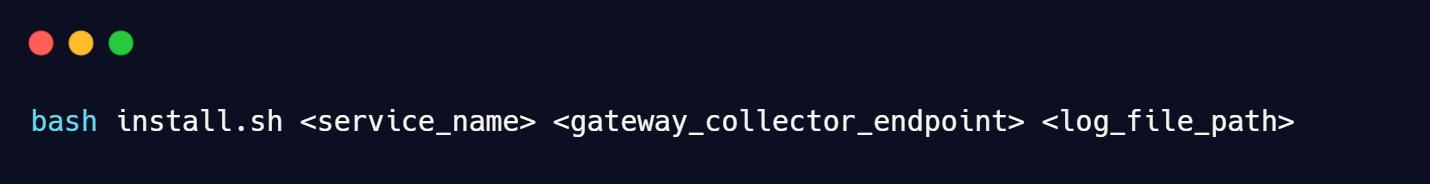
Set up Hypha Agent
Download the install script:

10. Future Work
We believe Hypha provides a great observability solution, but we're also excited about expanding its functionality. Here are some of the features we'd like to implement in future iterations:
- Add instrumentation support for more languages (Go, Python, Ruby)
- Add support for additional logging libraries and formats
- Containerize the Hypha Agent to support more deployment options such as Kubernetes
- Automate configuring TLS certificates for Hypha backend endpoints
References
Charity Majors et al., Observability Engineering
Cindy Sridharan, Distributed Systems Observability
Ted Young, Getting Started with OpenTelemetry for Go
Lightstep, Inc., OpenTelemetry Core Concepts: Context Propagation
Austin Parker et al., Distributed Tracing In Practice
Jamie Riedesel, Software Telemetry
Open Telemetry, Open Telemetry Logging Overview
Grafana Labs, Grafana Loki - Deployment Modes
Team


